Chrome DevTools: Print out a quick stack trace from the Console
Last updated: June 30, 2015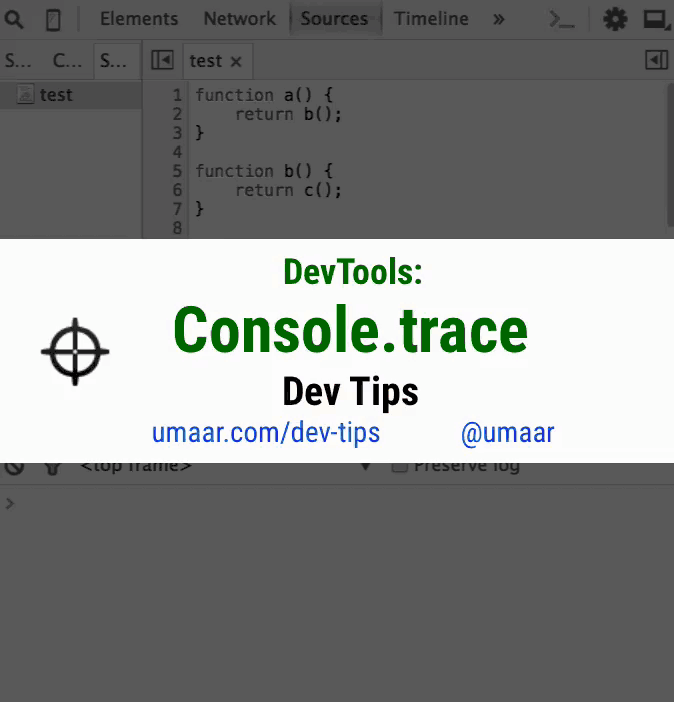
Introduction
You can use the Console Panel method console.trace() to get a quick and easy stack trace to better understand code execution flow.
Try it out
To try this feature, just paste the following JavaScript snippet into your Console Panel:
function a() {
    b()
}

function b() {
    console.trace();
}

a();
You can click on the links within the trace result to navigate to the relevant piece of code.
Notes
Extra notes on the console.trace() feature:
- You get file names and line numbers which you can click on to navigate to the source.
console.traceis compatible with the snippets feature of Chrome DevTools.console.traceis part of the Console API (just likeconsole.log)
Extra resources
- There are lots of useful methods on the Console object, such as:
- You can also find some bonus Console Panel Tips and Tricks