Chrome DevTools: 5 tricks to use in the Console Panel
Last updated: May 4, 2015
Introduction
The Console Panel is full of handy little features which can improve your debugging and development experience.
Locate a JavaScript DOM element in the Elements Panel
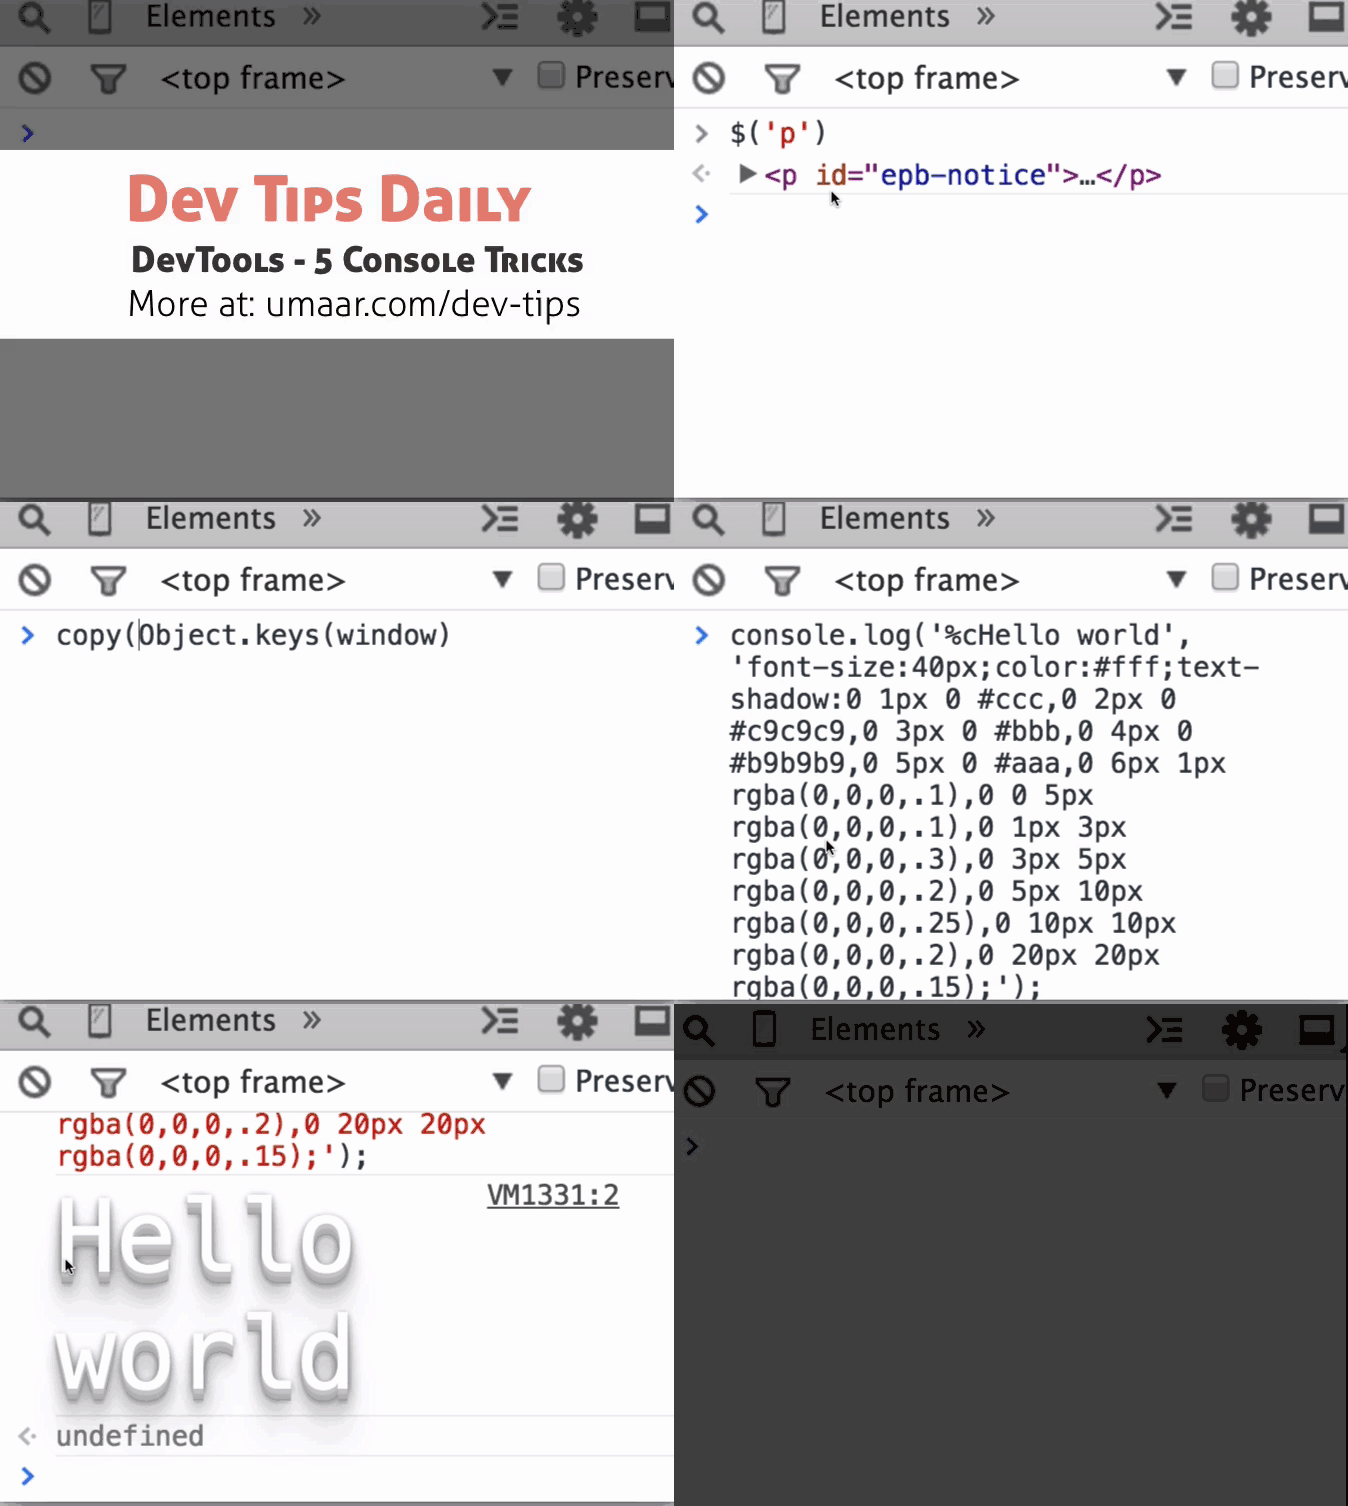
Use the inspect() function to jump straight to the specified element. You can run this in the Console Panel, and it'll find that p tag in the Elements Panel.
inspect($('p'))Copy the result of JavaScript expressions into your clipboard
You can use the copy() function to copy text to your clipboard:
copy(Object.keys(window))

// stores ["top", "window", "location", "external"... and so on, into your clipboard
Styles console logs:
You can use some limited CSS to style your console log output.
console.log('%cHello world', 'font-size:40px;color:#fff;text-shadow:0 1px 0 #ccc,0 2px 0 #c9c9c9,0 3px 0 #bbb,0 4px 0 #b9b9b9,0 5px 0 #aaa,0 6px 1px rgba(0,0,0,.1),0 0 5px rgba(0,0,0,.1),0 1px 3px rgba(0,0,0,.3),0 3px 5px rgba(0,0,0,.2),0 5px 10px rgba(0,0,0,.25),0 10px 10px rgba(0,0,0,.2),0 20px 20px rgba(0,0,0,.15);');Get the values of an object
The function values() is built into the Console Panel.
values({
	one: 1,
	two: 2,
	three: 3
})

// logs [1, 2, 3]
Update July 2020
This feature is built into JavaScript, the language. You can use it in client side JavaScript or even Node.js:
Object.values({
	one: 1,
	two: 2,
	three: 3
})
Clear the console
A quick and handy shortcut to clear all console messages.
Cmd + K (Ctrl + L on Windows)Extra
- The Console Panel has some powerful autocomplete features
- Use
console.tableto format your object into something more useful