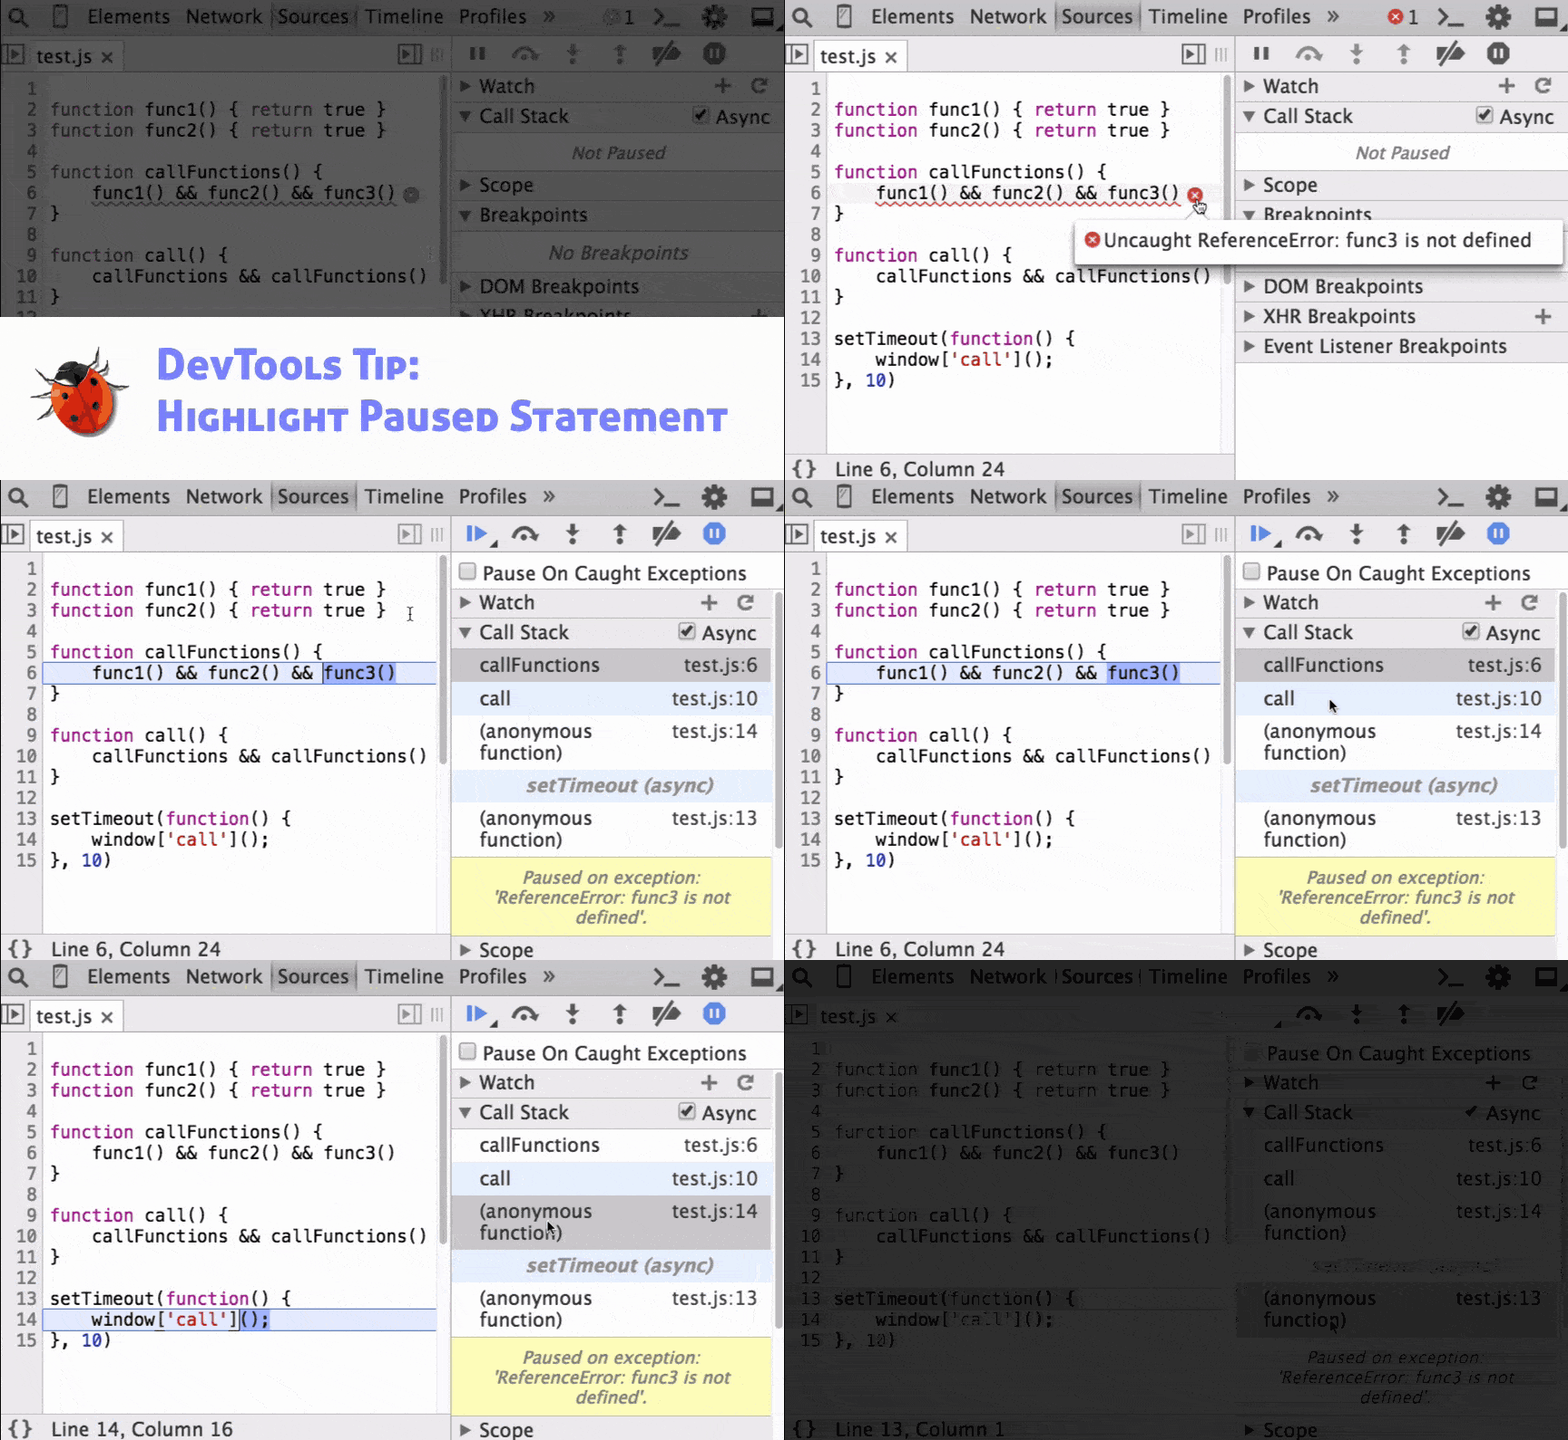
Chrome DevTools: See the exact statement which executed with granular highlighting
Last updated: April 22, 2015
When the debugger is paused, you can now see the exact portion of code which executes. It's highlighted in a darker shade of blue. This can be useful when debugging minified code.
Extra information
On the note of JavaScript debugging, you can easily pause on JavaScript code without having to manually set breakpoints. Here's how that feature works.
Additionally, there are shortcuts you can use while paused at breakpoints.