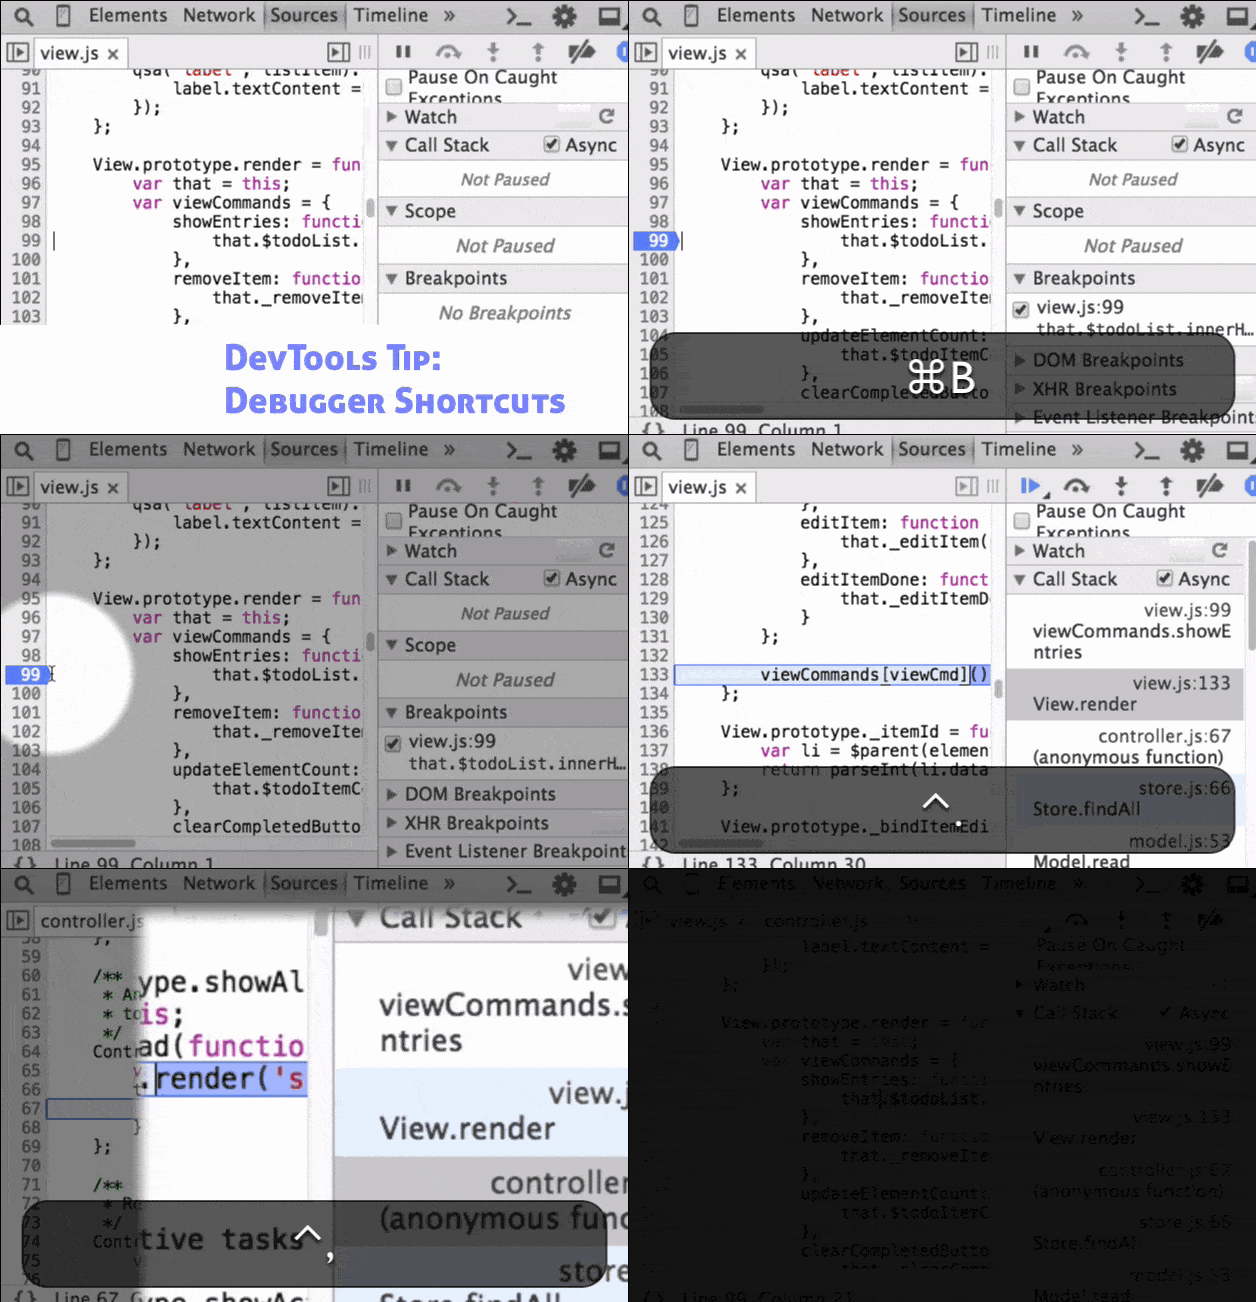
Chrome DevTools: Set a breakpoint and navigate through the call stack with keyboard shortcuts
Last updated: April 27, 2015
There are a few keyboard shortcuts when dealing with the debugger. A few are:
- Toggle a breakpoint while on a line: Cmd + B
- Select the next call frame: Ctrl + .
- Select the previous call frame: Ctrl + ,
Also, you may notice from a few Dev Tips ago (21. highlight paused statement) that when you navigate through the call stack, the exact column is highlighted.
Debugging in DevTools has been improving over the years, for example you can now easily pause on JavaScript code without manually setting breakpoints. Learn how in this tip