Chrome DevTools: Frequent screenshots in the Performance Panel
Last updated: July 16, 2015
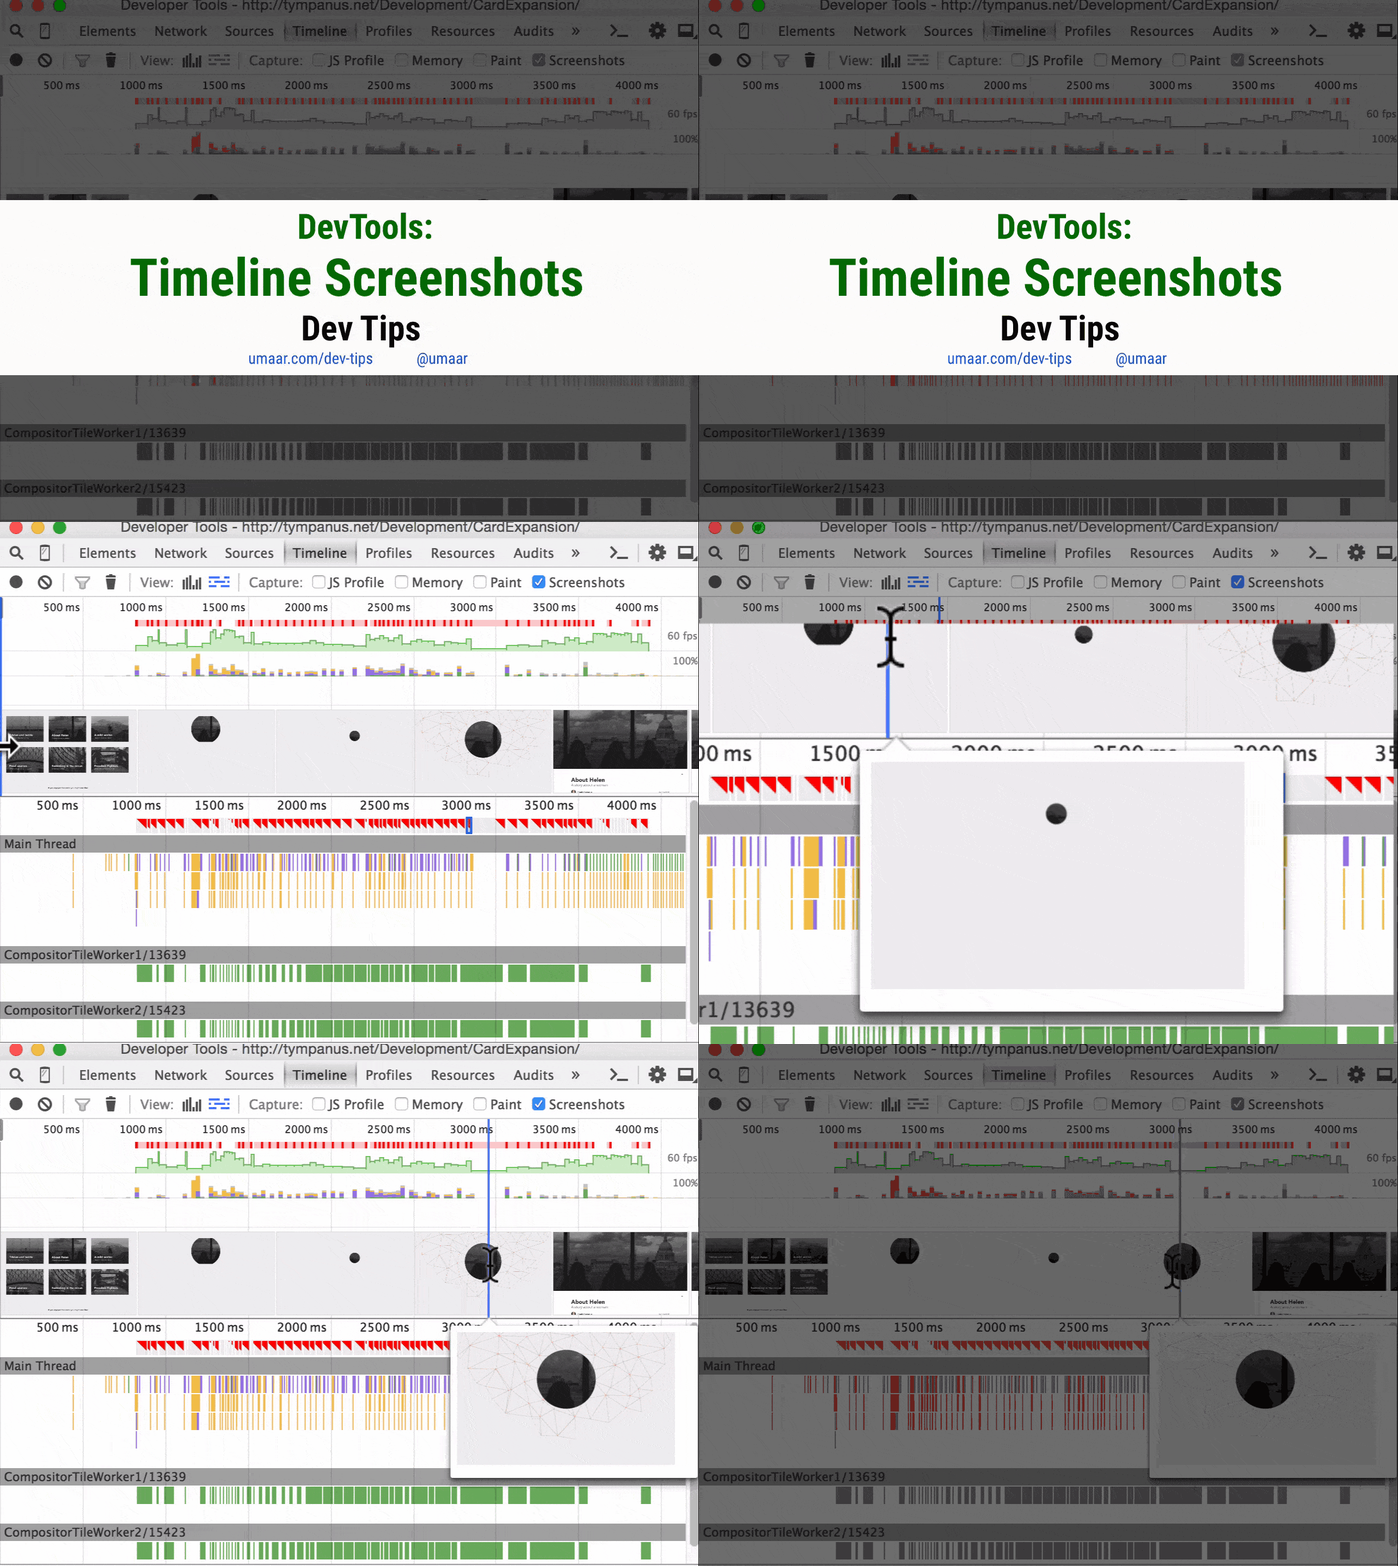
You can start capturing screenshots in the DevTools Performance panel. If you move your mouse from the start of the recording to the end, you can see the visual state of the page over time.
You can then match frames which have spiked (or have a warning against) to the relevant screenshot to understand what the page was doing at the point of poor performance.