Chrome DevTools: Inspecting and debugging CSS Grid
Last updated: September 27, 2020
Introduction
CSS Grid inspection is now possible from the Elements Panel. This is helpful for debugging CSS issues, and learning more about CSS Grid.
There's also a dedicated Layout Pane in the Elements Panel, which provides customization options for the CSS Grid Inspector. You can view:
- Grid lines
- Track sizes
- Area names
Which can all be helpful in understanding how rows and columns play a part within a CSS Grid.
How to use this feature
- Locate an element using
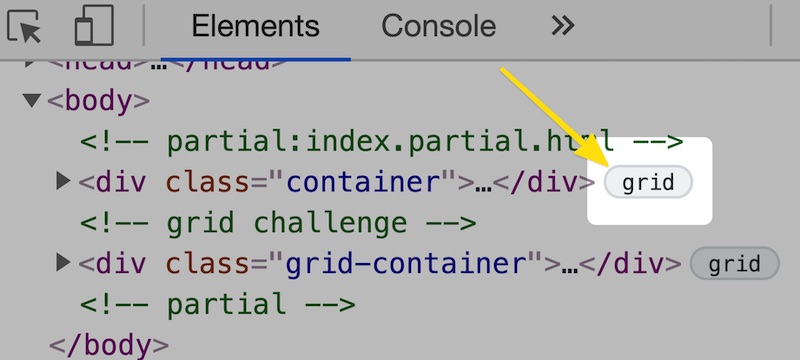
display: grid. - Click the label marked
gridin the DOM Tree. - Select
Show Layoutfrom the Command Menu (Cmd + Shift + P). - Explore the different options available here, such as:
- Toggling
Grid overlayson and off. - Enabling
track sizes,area namesand extendedgrid lines.
- Toggling
Note, if you do not see a Layout Pane in the Elements Panel, then you can check that CSS Grid Debugging is enabled:
- Open
Show Experimentsfrom the Command Menu (Cmd + Shift + P). - Check the box labelled
Enable new CSS Grid debugging features. - Restart DevTools with the shortcut Alt + R.
Extra
- The Inspect Element feature can also provide contextual information via the Inspect Element Tooltip.
- Check out the CSS Grid and Flexbox Editor.