Chrome DevTools: Dive into slow webpage activity with Long Task indicators
Last updated: February 12, 2019
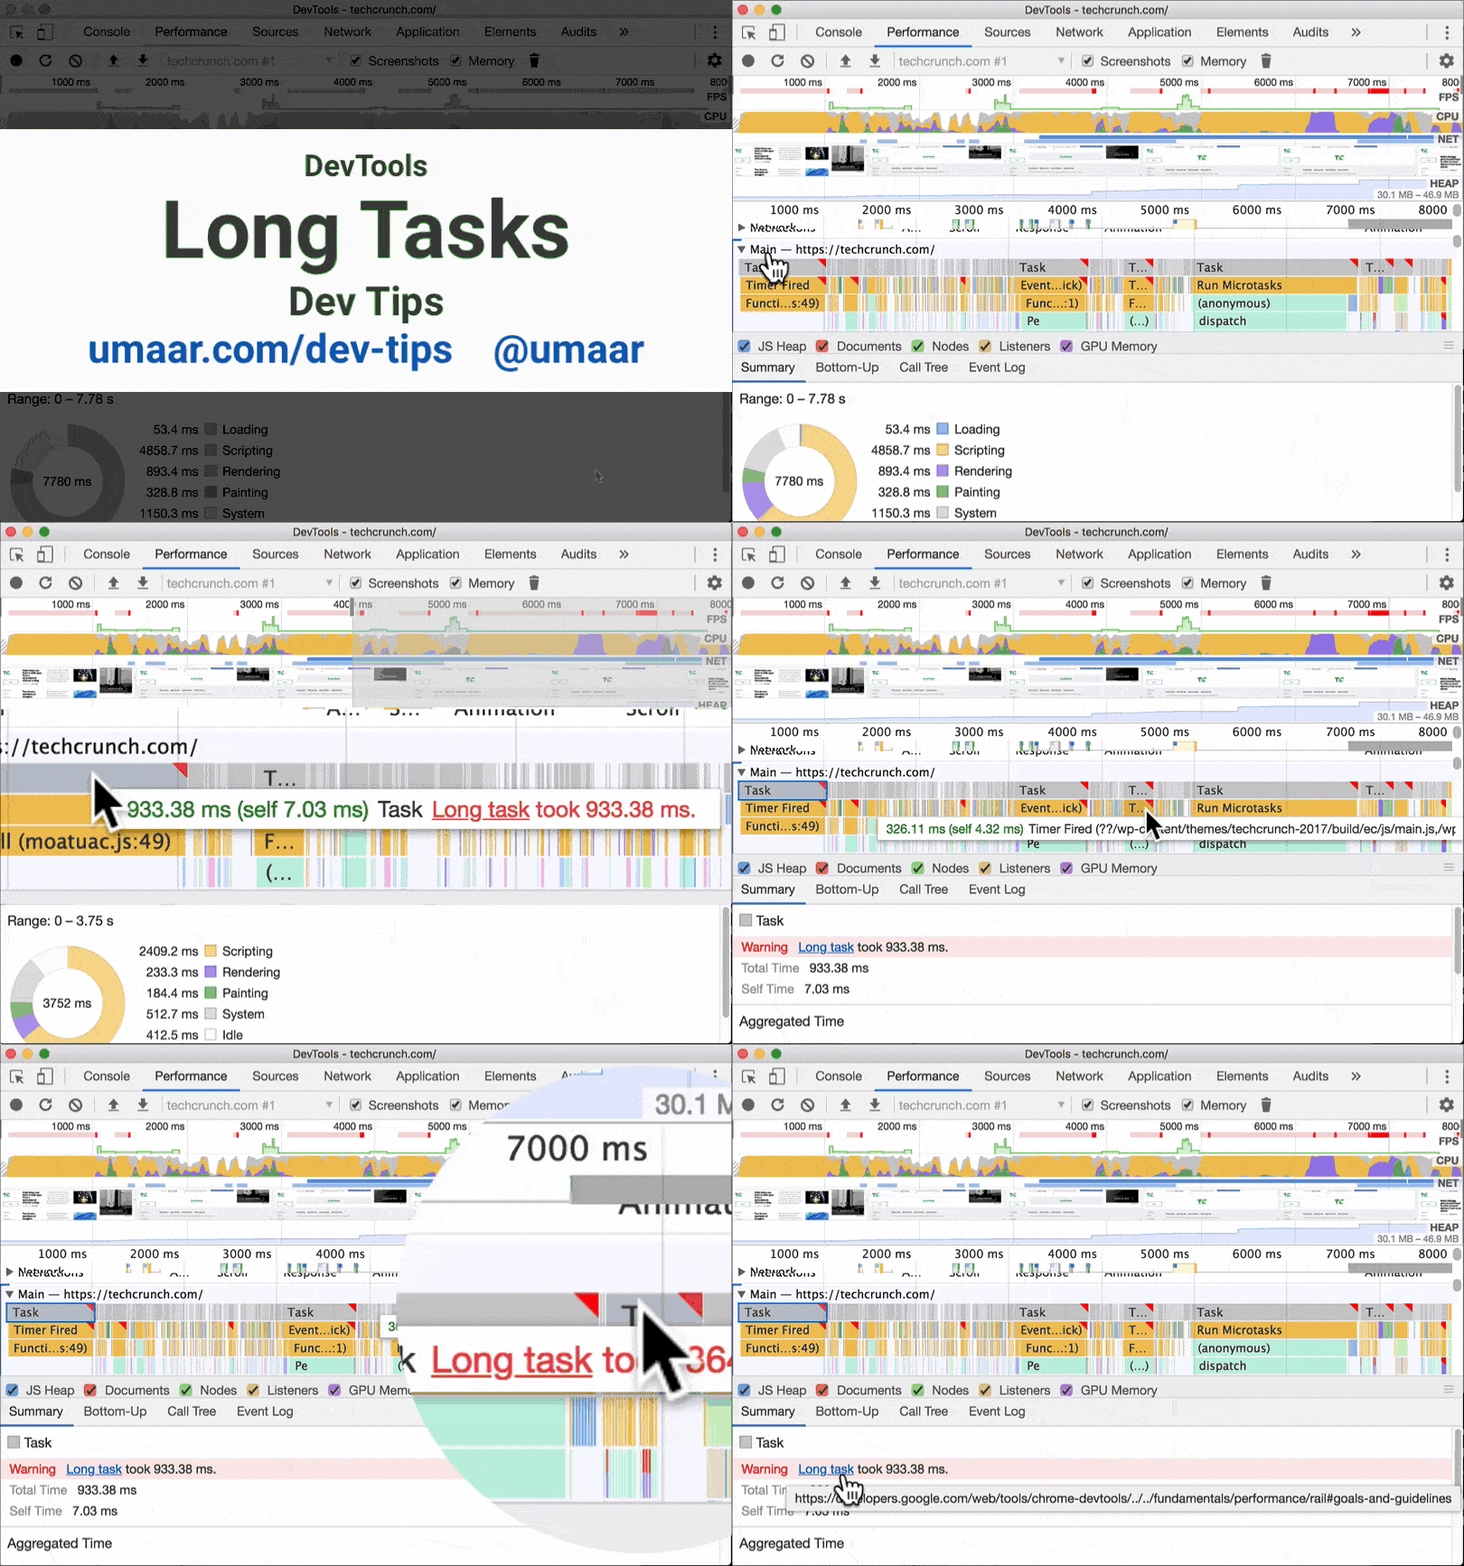
The Long Task indicator in the Performance Panel can give you a high-level overview of which activity is taking a long time to execute. To try it out:
- Record a performance profile of some webpage activity, e.g. the loading of techcrunch.com
- Look for the red flag 🚩️ icons in the Main Thread. They are contained within grey coloured bars which are labelled 'Task'
- Hover over a long task and notice the tooltip specifies the duration of the long task
From this point on, your goal would be to look at the low level activity which occurred within a long task and understand why it is happening.
💡️ Tip: You can programmatically observe long tasks using the Long Tasks API in JavaScript. The code looks like this:
const observer = new PerformanceObserver((list) => {
	console.log('Long Task detected! 🚩️');
	const entries = list.getEntries();
	console.log(entries);
});

observer.observe({entryTypes: ['longtask']});