Chrome DevTools: Better Paint markers in a Performance recording
Last updated: February 19, 2019
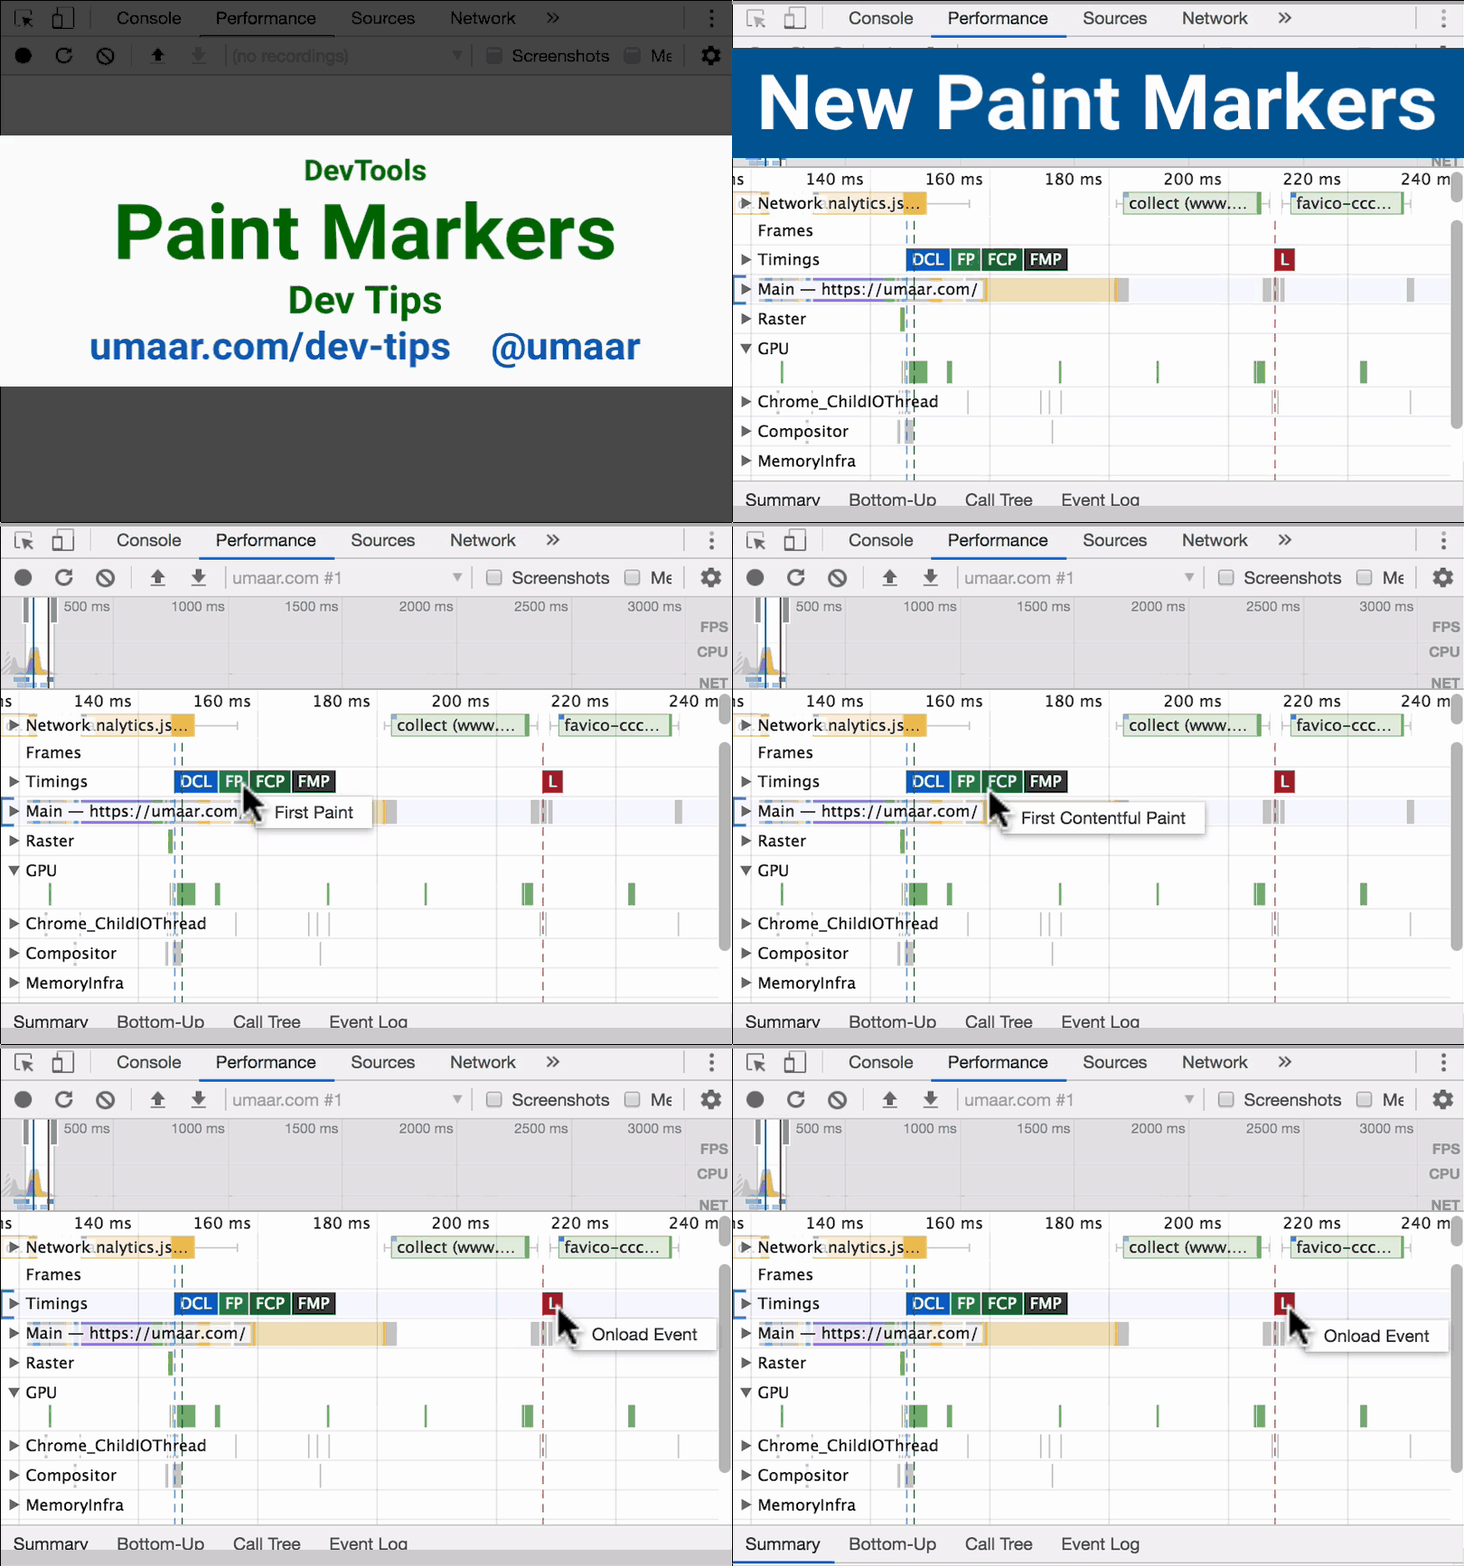
DevTools includes new markers which can explain to you the render progression of your website. The markers are:
- DOMContentLoaded - Initial HTML is ready
- First Paint - Something (anything) has been drawn
- First Contentful Paint - Something has been rendered from the DOM
- First Meaningful Paint - The drawn content is useful (read more)
- Onload - All resources are ready
These Markers are shown the the Timings section of a Performance Panel recording. As a challenge, see if you can correlate the markers with the visual progression you see in the Network requests + screenshots section. Note: these sections are still included within a Performance Panel recording, just make sure you have the Screenshots checkbox checked!.
Bonus: I wrote an article about the Paint Timing API where you can learn more about the First Paint + First Contentful Paint events listed above.