Chrome DevTools: Instant performance suggestions with Console Violations
Last updated: January 29, 2019
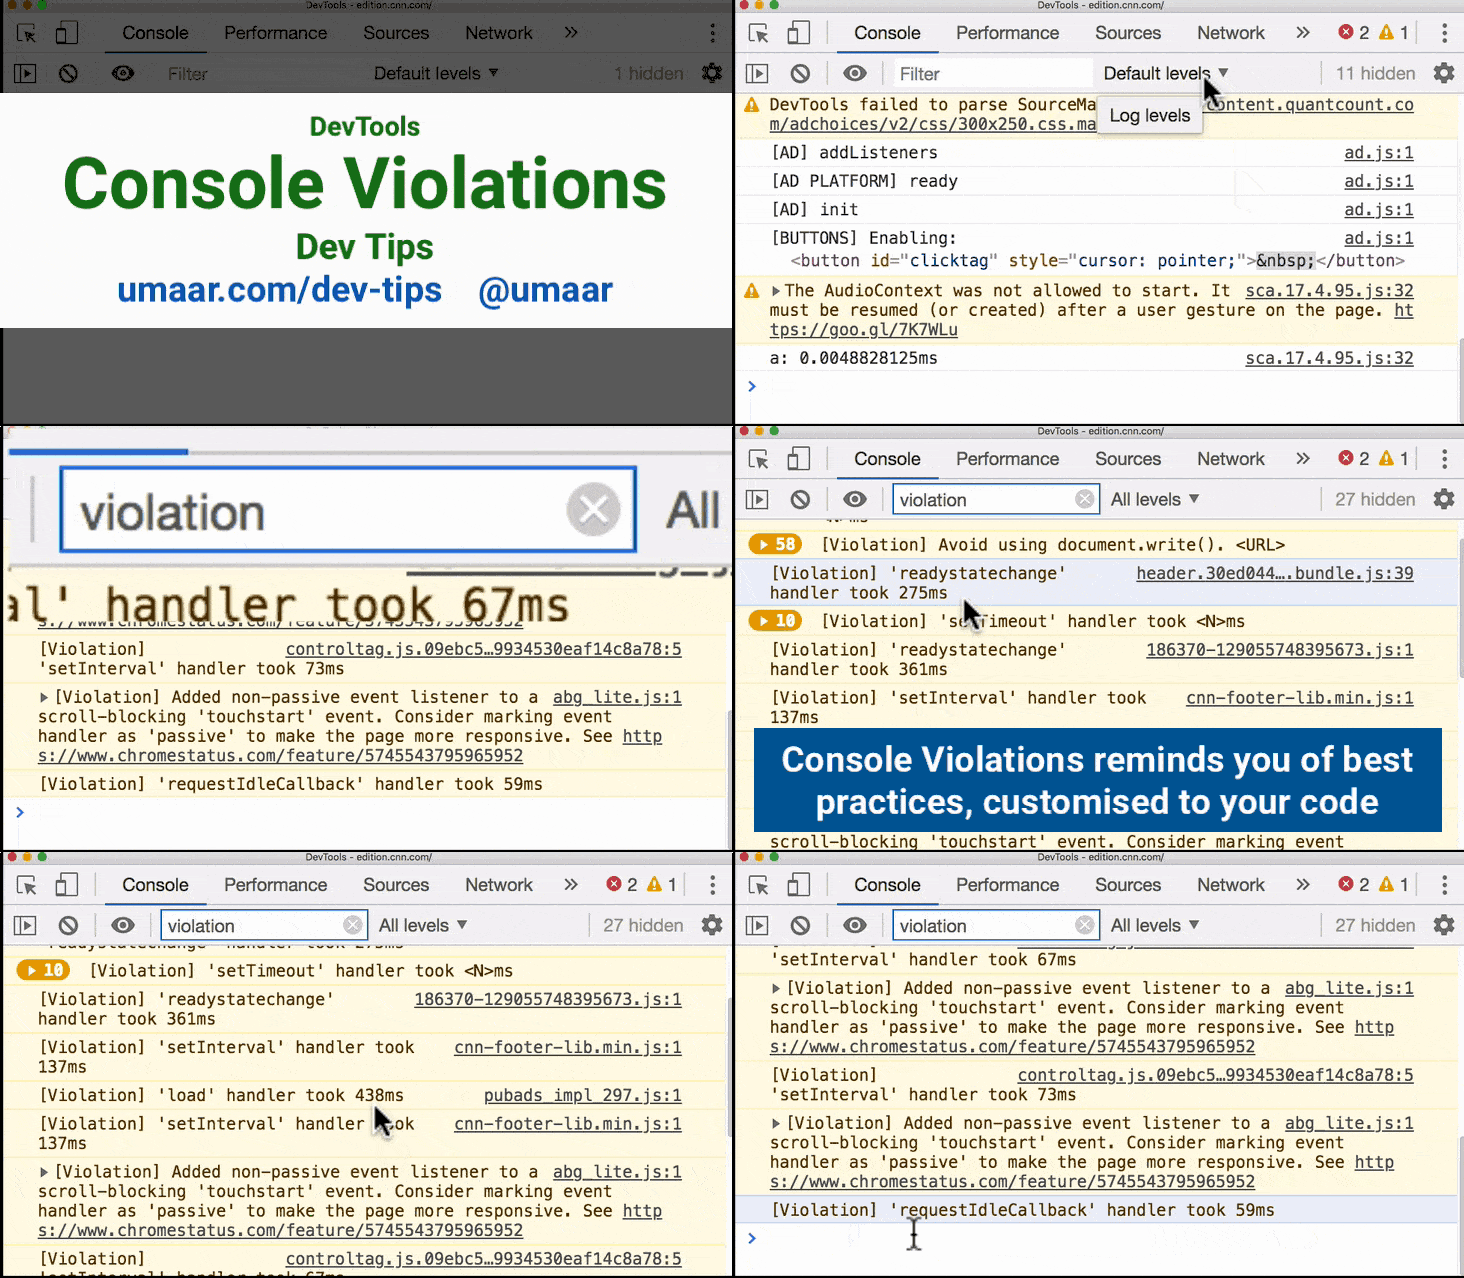
Console Violations reminds you of best practices, customised to your code.
A benefit of using this feature is: there's no need to run a Performance Profile, or to run an Audit, since violations are shown as the offending code executes (e.g. on page load).
To view Console Violations:
- Click the 'Default levels' dropdown in the Console Panel and select 'Verbose'
- Type in
violationin the Console Panel filter box
Violations can provide valuable performance insight into your code, such as:
- JavaScript which forced a reflow
- JavaScript which used
document.write - Slow executing
setTimeouthandlers - Inefficient event listeners
- And many other violations