Chrome DevTools: Deeper performance insights with network and rendering performance
Last updated: May 24, 2017
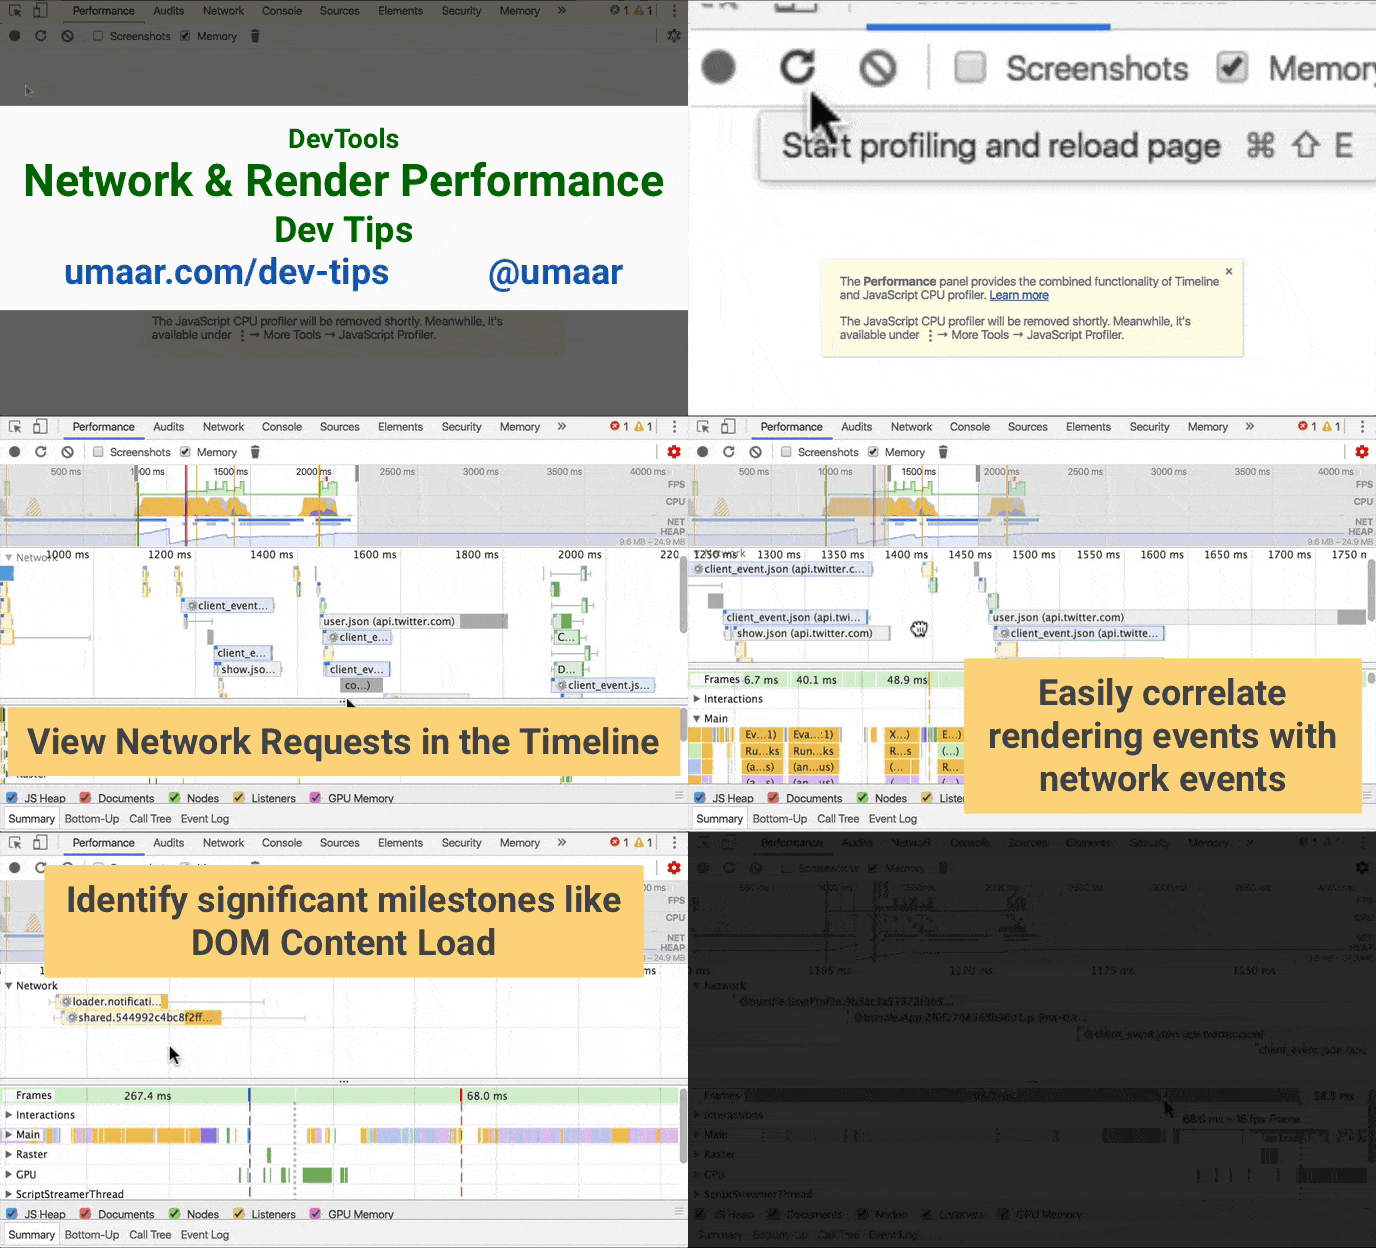
You can view Network Request information in a Timeline recording within the Performance Panel.
You can also correlate the network resource start & end times, along with the rendering activity in the main thread.