Chrome DevTools: Quickly jump to other code while debugging JavaScript
Last updated: May 22, 2017
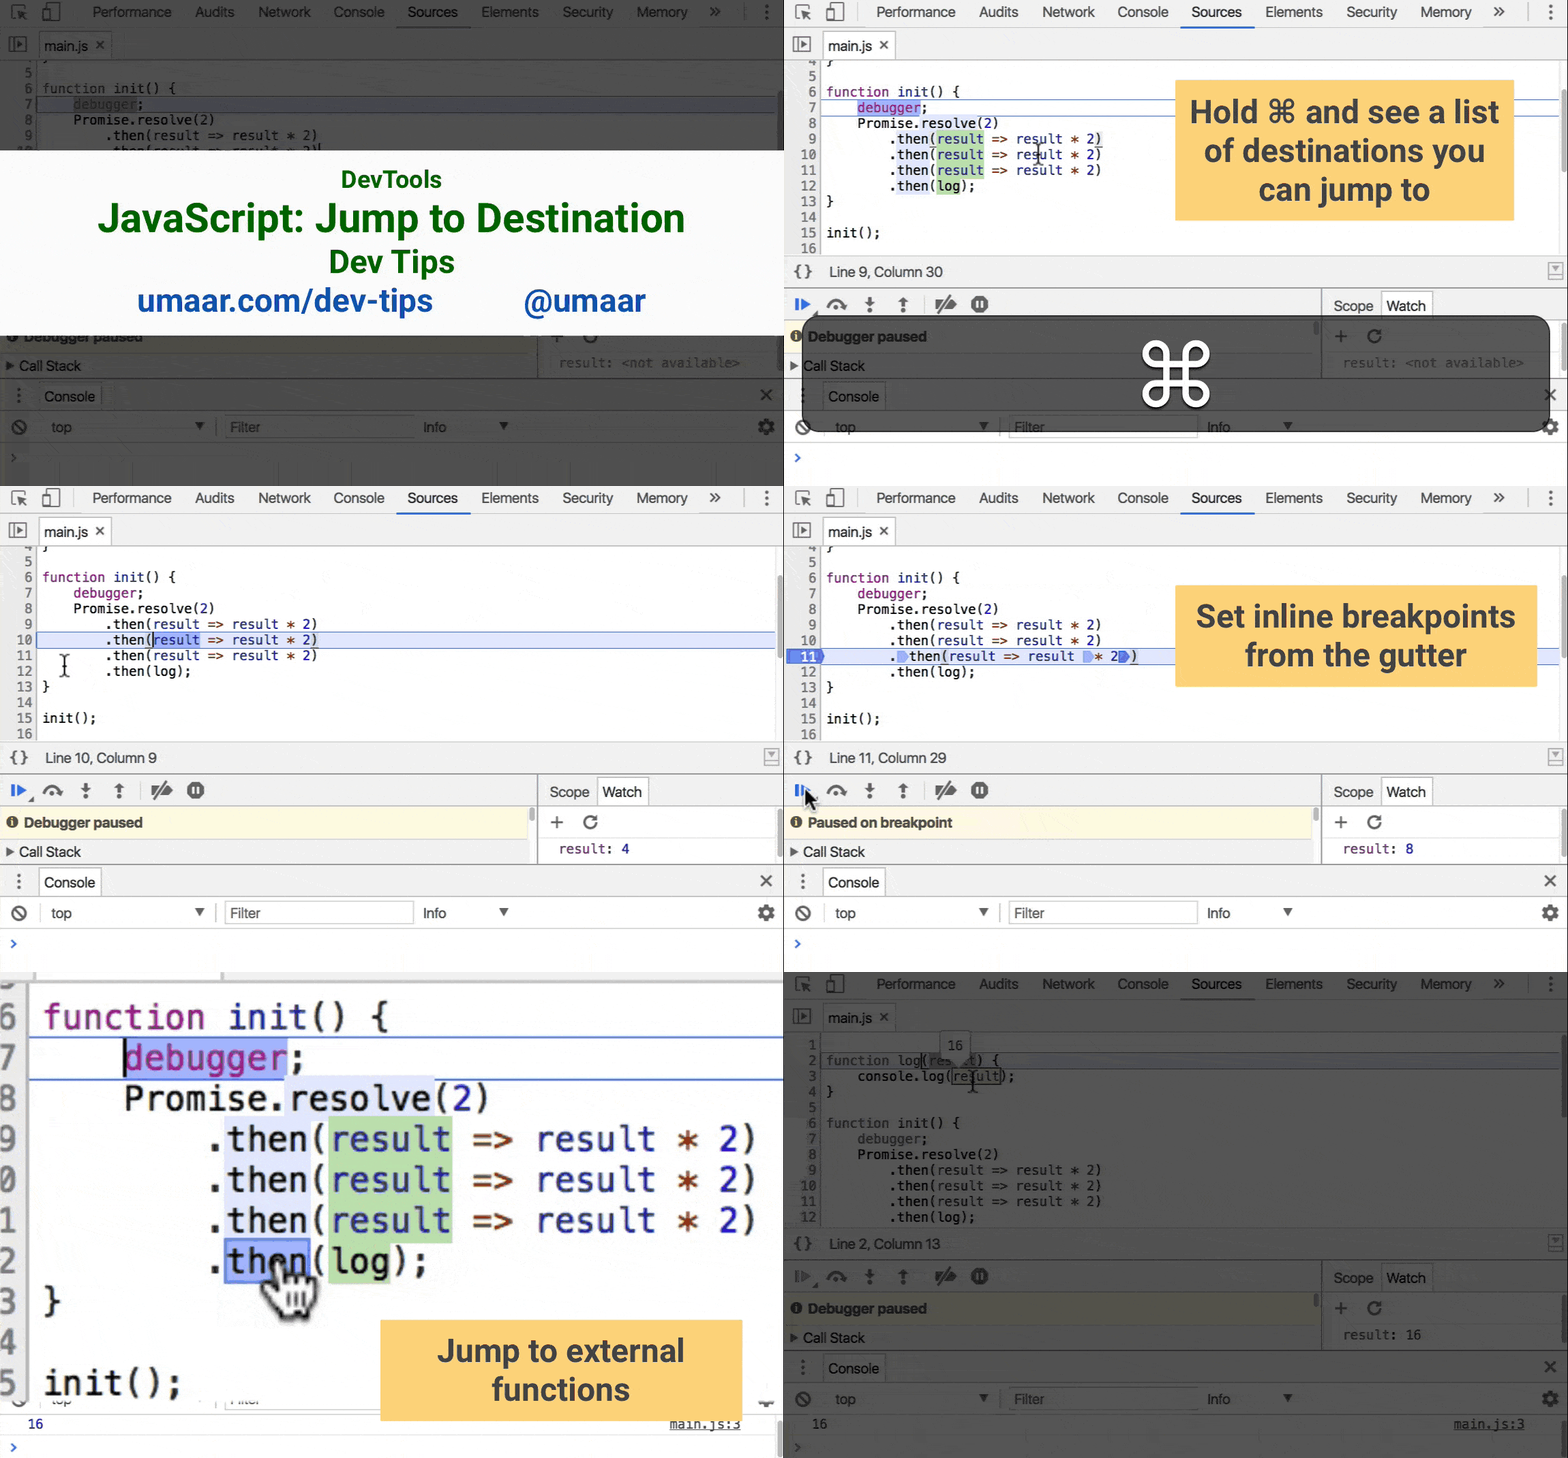
You can easily jump, via the debugger, to new JavaScript destinations when you are paused at a breakpoint.
To do this, hold the Cmd/Ctrl key while you are paused at a breakpoint. DevTools displays jumpable destinations. You can then click 🖱 to jump to that destination.
Note: This gif also shows inline breakpoints, which is covered in Tip #129