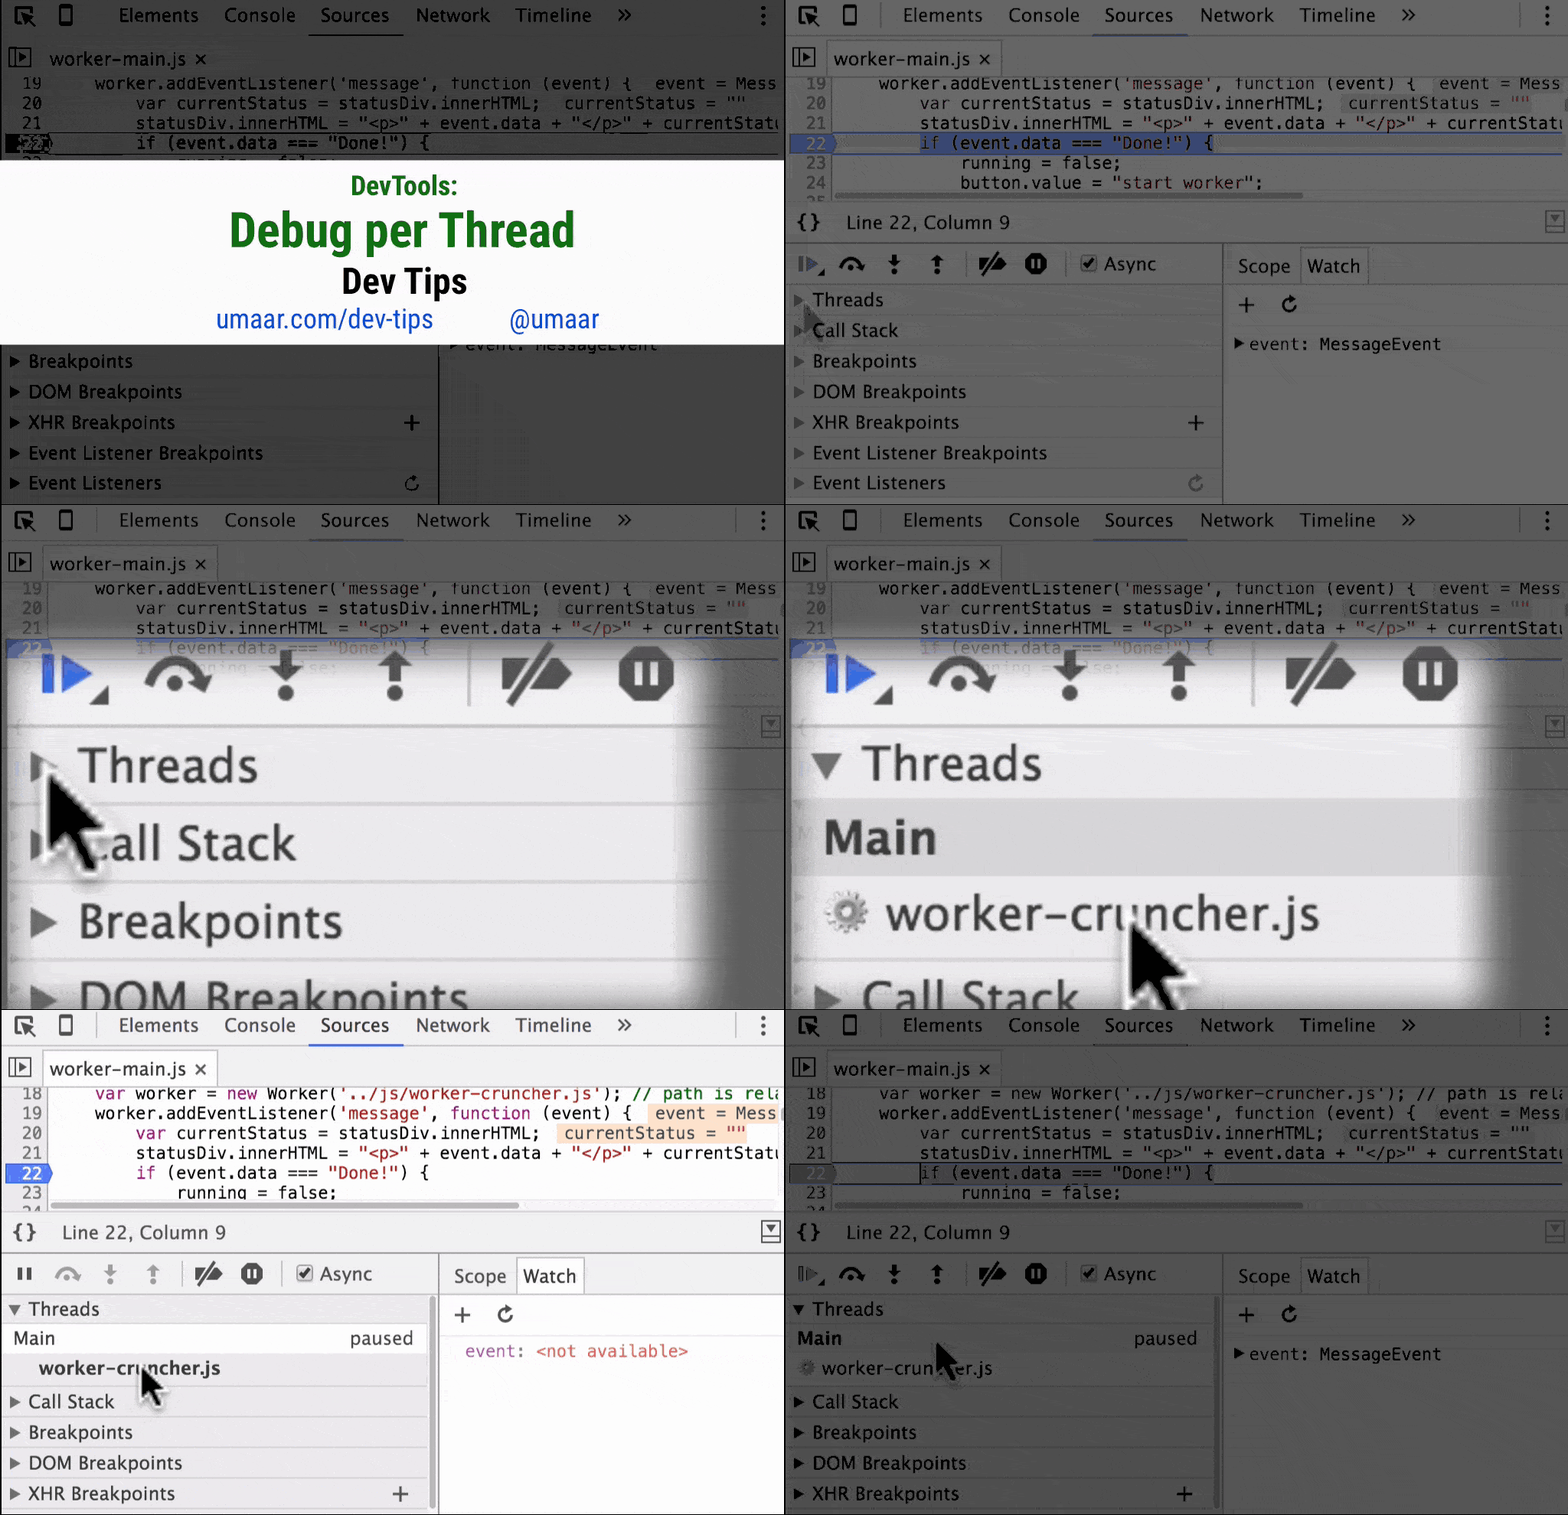
Chrome DevTools: Use the Threads pane to debug multiple JavaScript threads
Last updated: January 7, 2016
If you're using JavaScript features which makes use of multiple threads, such as Service Workers or Web Workers, the Sources Panel takes this into account.
Since each thread has its own global script context, you can select a specific thread to debug (to set a breakpoint on for example). Just open up the 'Threads' pane in the Sources Panel. You should see the main thread and any others which are available.
You can try a demo here html5demos.com/worker