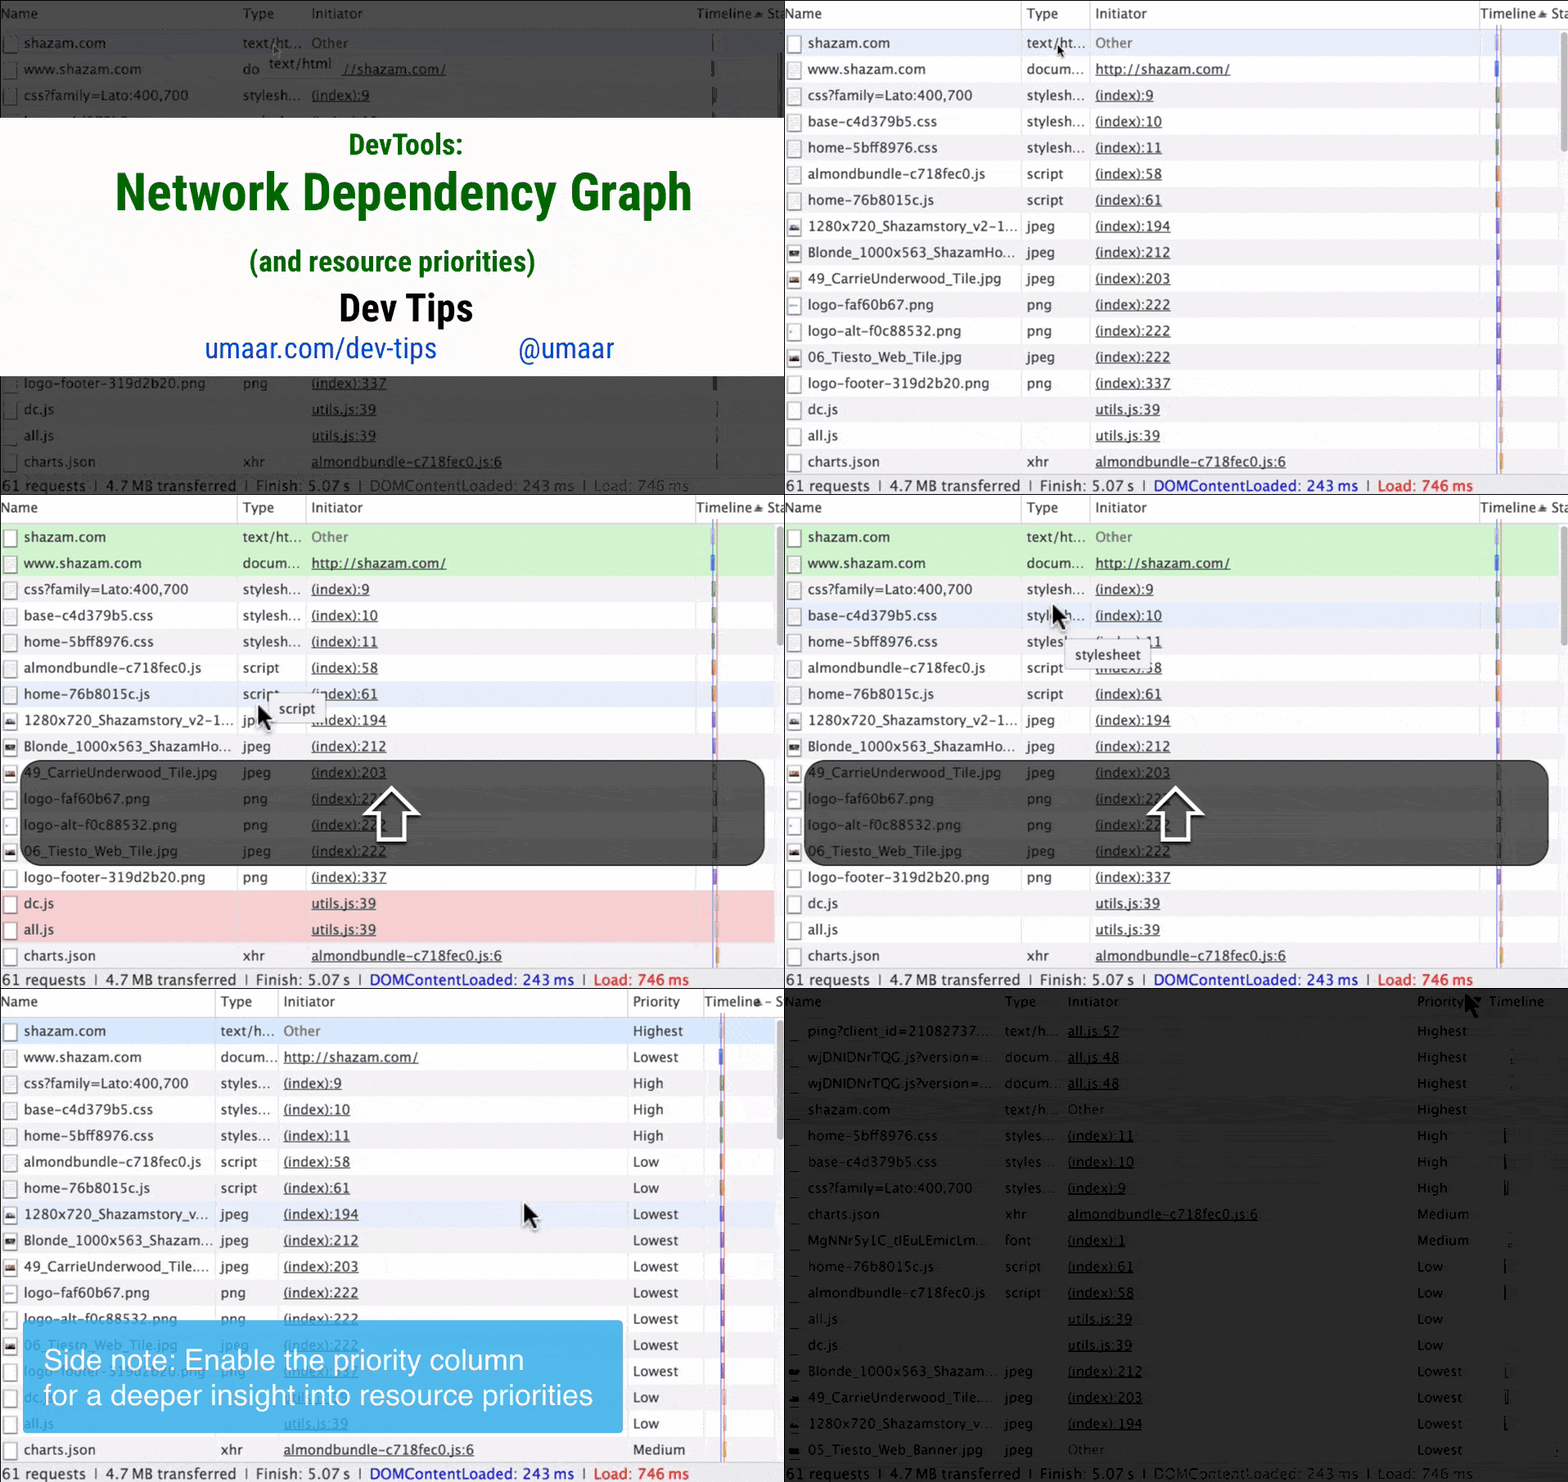
Chrome DevTools: A visual representation of the network asset dependency graph
Last updated: November 3, 2015
The network asset dependency graph visually shows the relationships resources have between each other. To try it out, hold shift and hover over the resources in a Network Panel recording.
The following two bullet points correspond to the resource you are currently hovering over:
- A resource highlighted in green initiates the request for the current resource.
- A resource highlighted in red is initiated by the current resource.
As a side note, the Network Panel is full of interesting columns. Try enabling some, such as the "Priority" column. This shows the priority the browser assigned to a particular resource (e.g. high, medium or low)