Chrome DevTools: DevTools (Performance) Easily identify long frame times
Last updated: July 1, 2015
Introduction
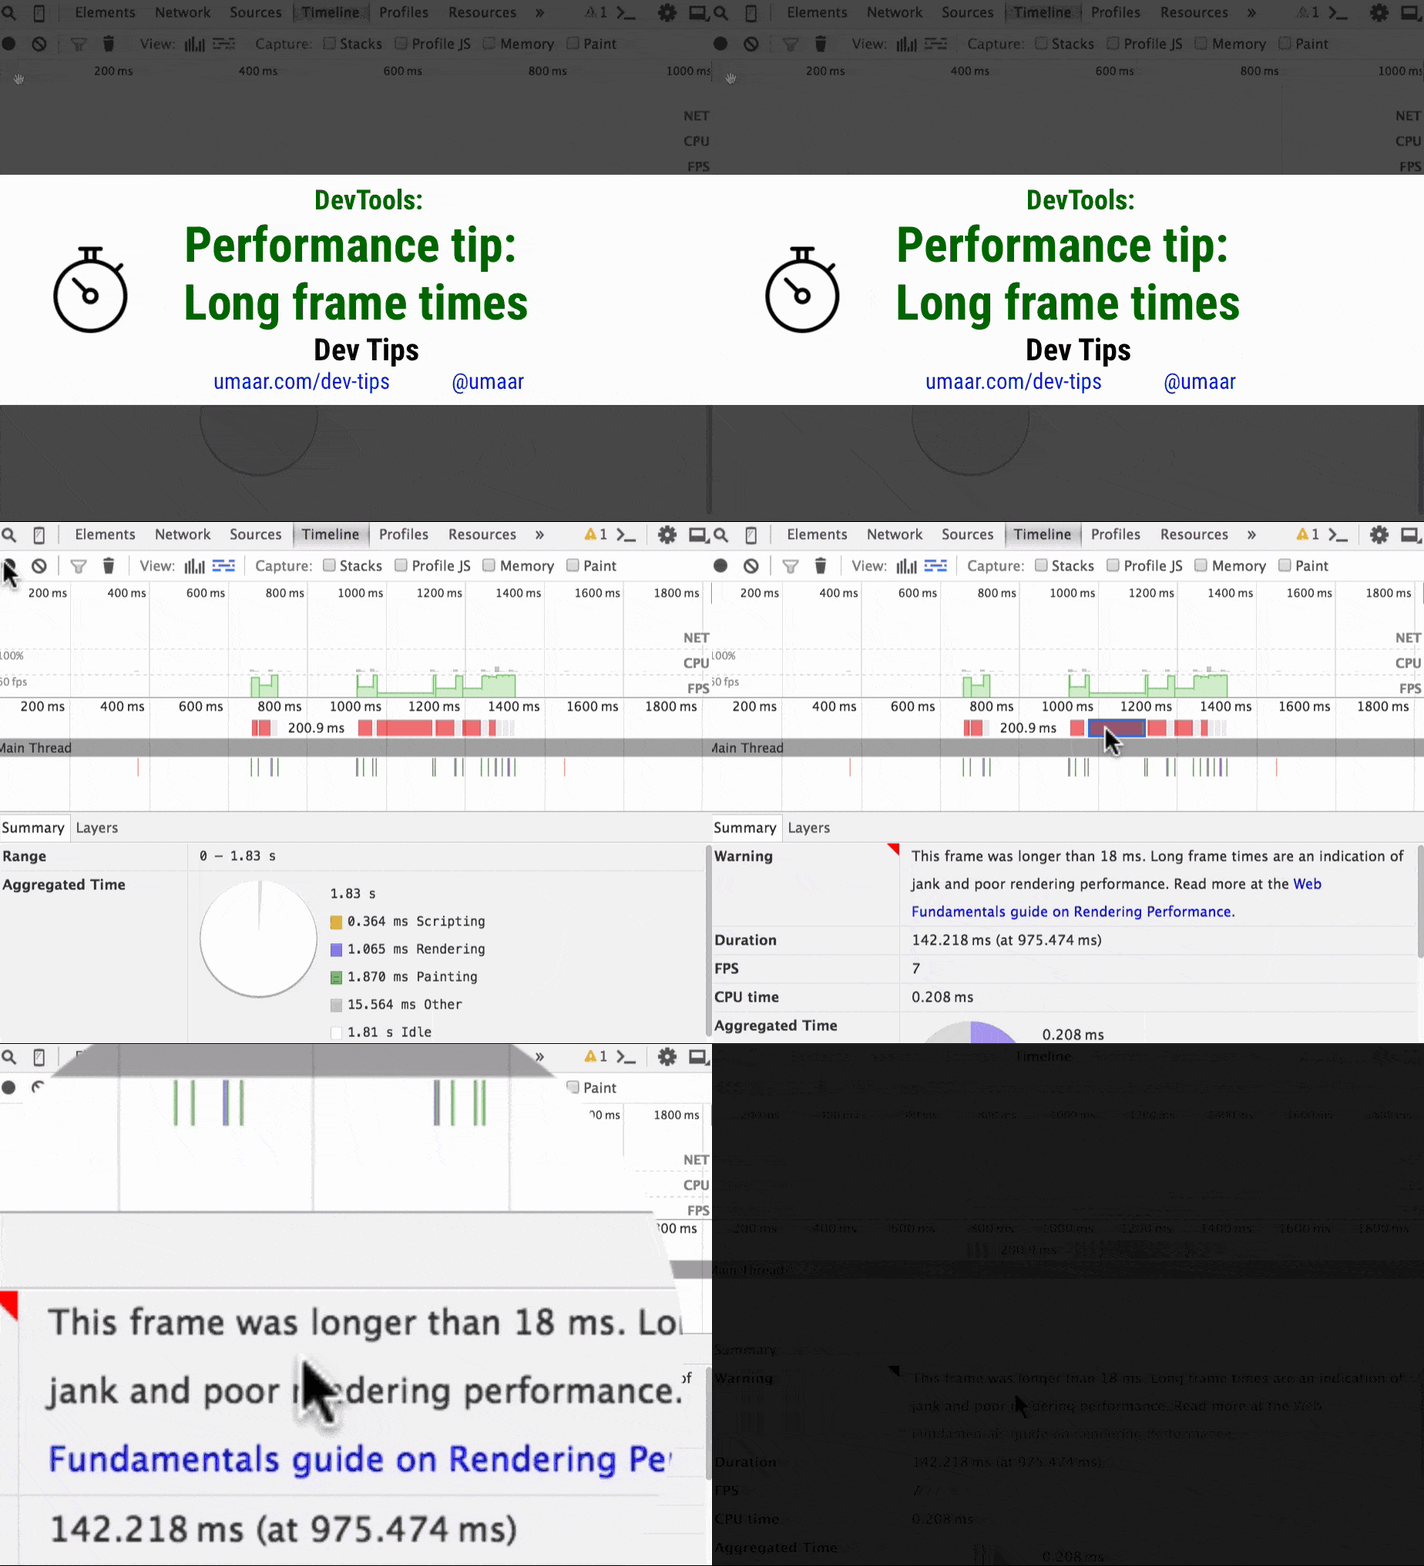
The Timeline Panel in can highlight certain frames red. This is because it has an associated warning, in this case, the frame took longer than 18ms.
How to use this feature
If you click on a long frame within the Performance Panel, the Summary Pane shows the reason in the form of a warning.
If a screen is refreshing 60 times per second (which many screens do), that's only ~16ms per frame (since 1000 milliseconds / 60 fps = ~16ms).
Extra resources
- The Modern DevTools Video Course goes into performance profiling in a lot more detail
- The Performance Panel in Chrome DevTools has lots of useful Paint Timing Markers which help identify key rendering milestones