Chrome DevTools: Visualise your JavaScript bundles
Last updated: October 29, 2021
Introduction
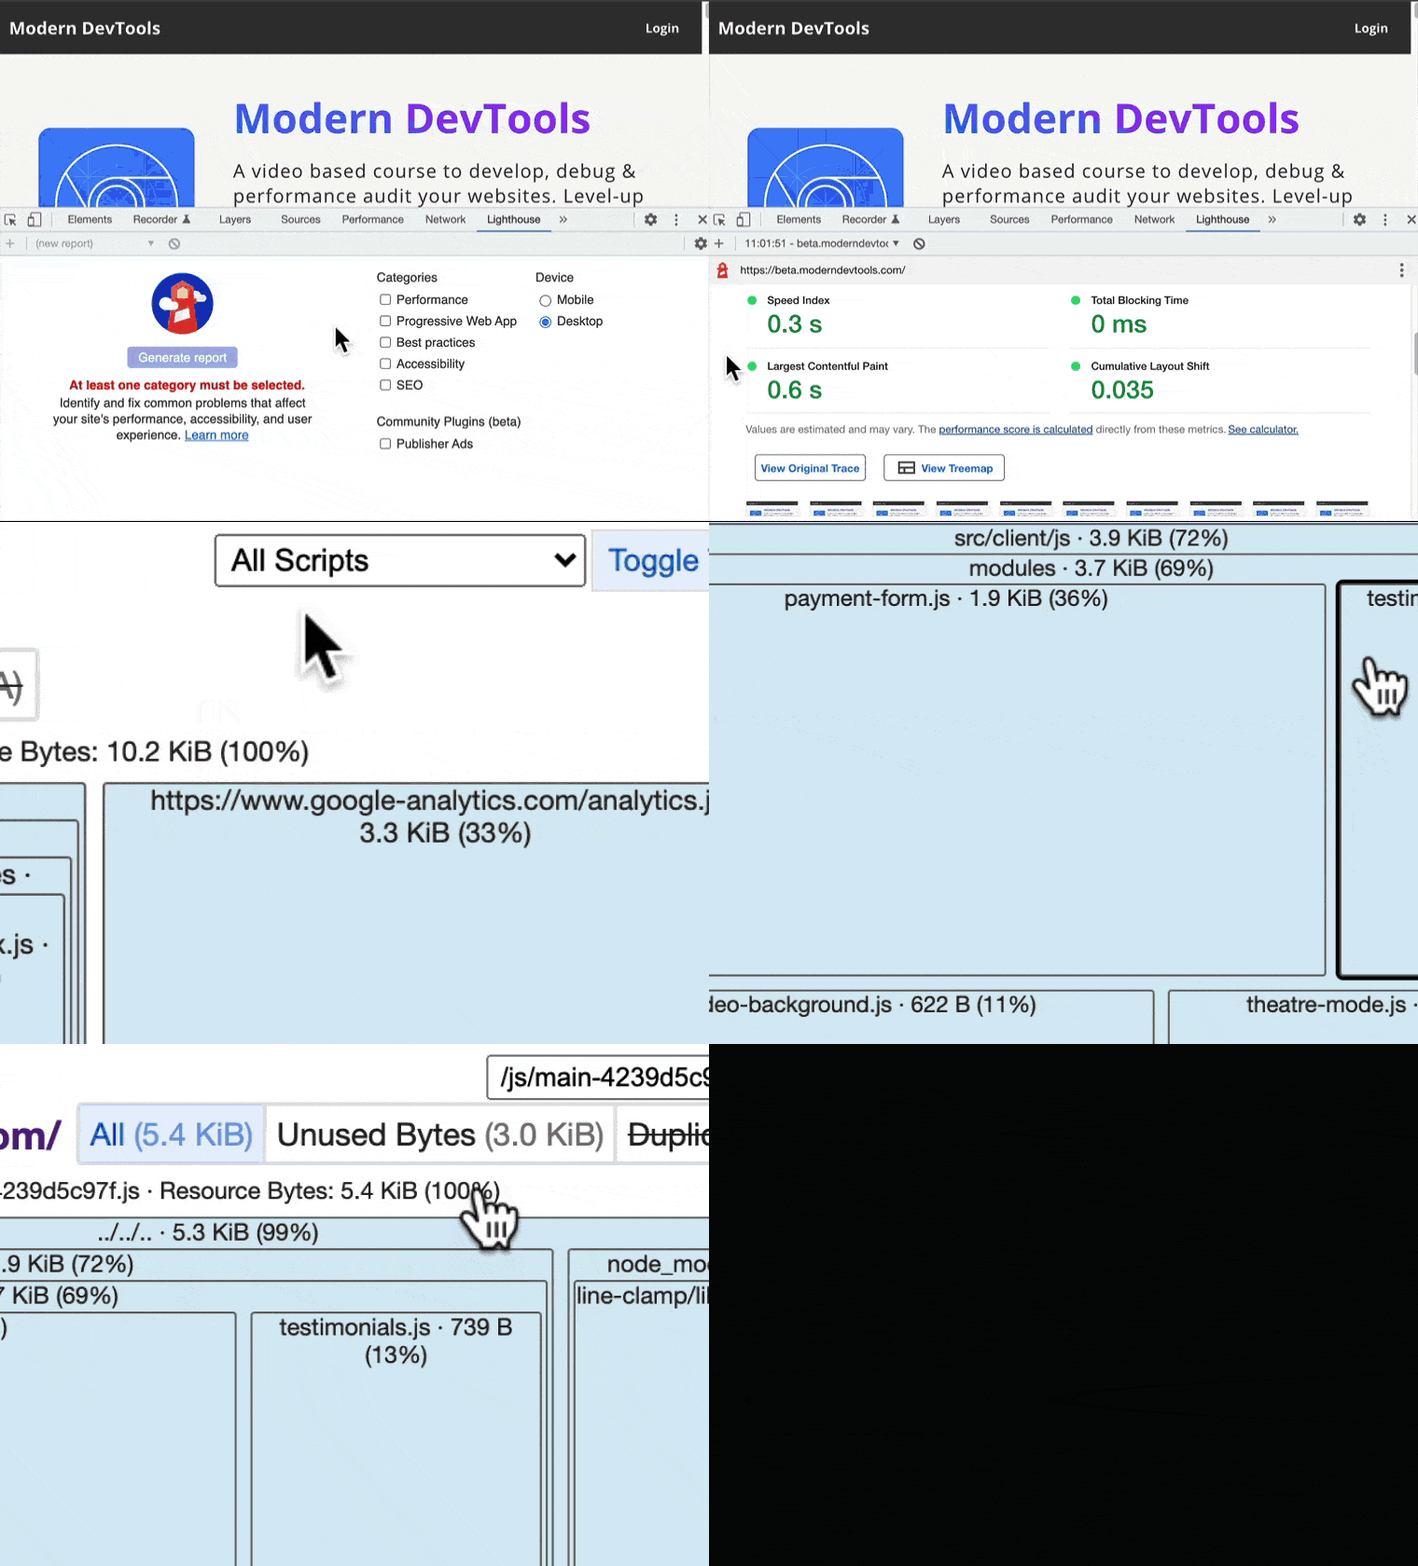
The Lighthouse Treemap shows a visualisation 📊 of your JavaScript bundles. It's compatible with sourcemaps and is great for understanding large JavaScript modules used by your page. It can also visualise unused bytes.
How to use the Lighthouse Treemap
To use the Lighthouse Treemap feature:
- With DevTools open, use the shortcut Cmd + Shift + P and search for Lighthouse.
- With the Lighthouse Panel open, enable the Performance category and select Generate report.
- With the performance report open, select View Treemap.
Nice work! You can now see a Lighthouse Treemap. At this point, you can do the following:
- Filter by individual bundles.
- Visualise the unused bytes in the JavaScript files.
- You can select individual files to dive deeper into them.
- You can view detailed coverage stats in the coverage section near the bottom of the page.
Bonus
- Thanks to sourcemaps, the visualisation can show you your original source files, for example your TypeScript files.
- It can be very helpful to dive into the files part of the
node_modulesfolder. The visualisation clearly shows which third-party scripts occupy a large amount of bytes. - You can run Lighthouse from the command line to see the treemap from a report.
Availability
This feature is currently in Chrome Stable, tested in version 95.
Further Resource
You can capture code coverage metrics while you make a Performance recording.