Chrome DevTools: Inspect videos with the Media Panel
Last updated: November 4, 2020
Introduction
The Media Panel in DevTools provides useful video inspection tools. This can be helpful in:
- Debugging custom video players.
- Understanding various media information like the duration or resolution of a video.
- Learning video codecs, and learning about video encoding/decoding.
How to use this feature
Trying this feature out is straightforward:
- Open a webpage which includes a video, such as a YouTube video.
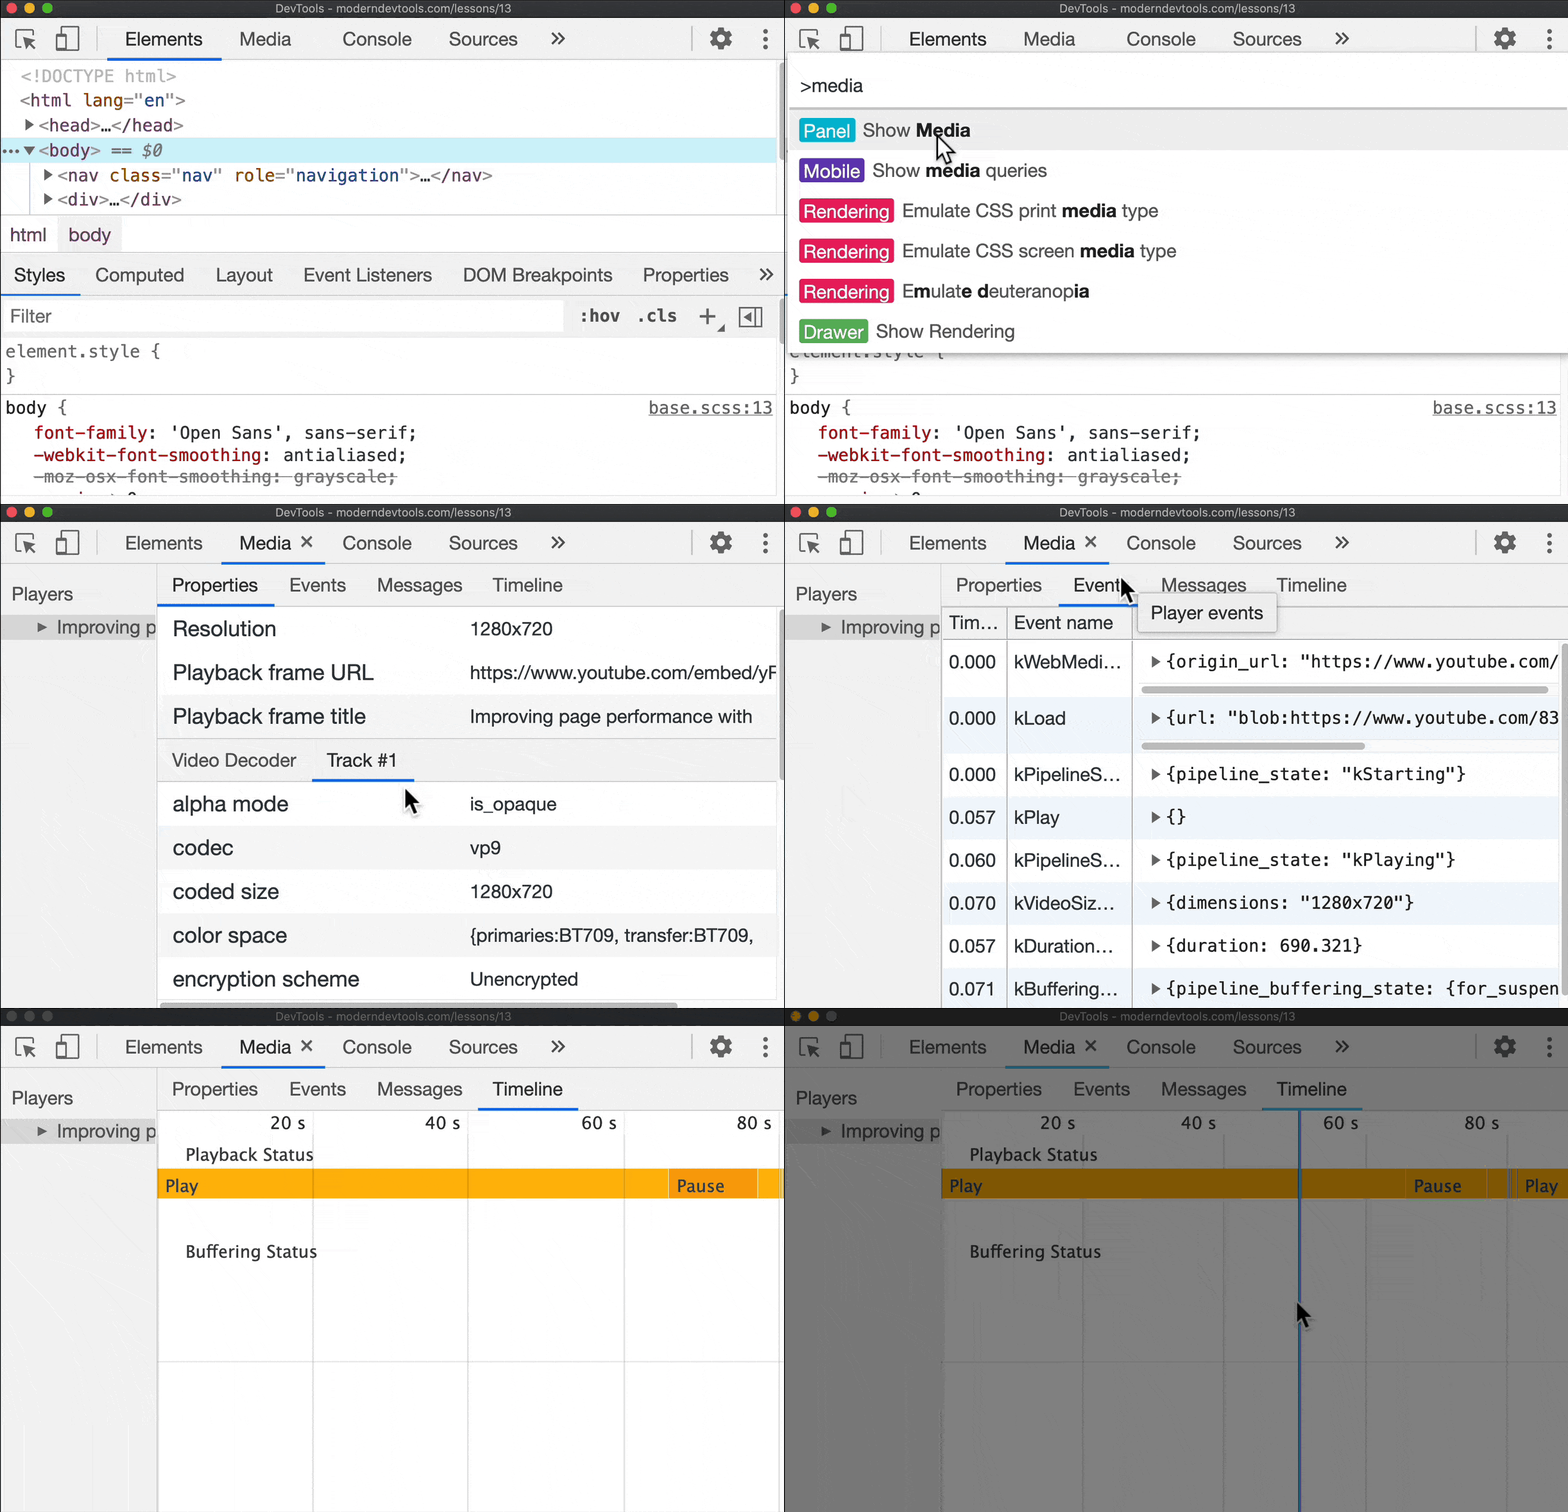
- Select Show Media from the DevTools Command Menu (Cmd + Shift + P).
- Observe the the media entry (or entries) in the Media Panel.
There are four tabs (panes) within the Media Panel:
- The Properties pane includes common media information (e.g. Resolution, Codec, Decoder used, Audio sample rate).
- The Events pane includes internal media events which relate to how the video is processed. Where applicable, this pane includes the event payload.
- The Messages pane contains diagnostic messaging from video decoding or processing.
- The Timeline pane has a visualisation for the playback and buffering status of the media, so you can see how the state of the media changed over time.
The Media Panel Properties Pane should be enough for most use cases, unless you're doing deep debugging work with media, such as building a custom video player in JavaScript. And on that note, if you are doing such work, you can find detailed explanations of the Media Events (as shown in the Events Pane) within the Chromium source code.
Extra
The Timeline Pane of the Media Panel visualises media playback/buffering states over time. There's also a Paint Profiler Pane in the Performance Panel which can visualise the drawing of a page over time.