Chrome DevTools: Intercept and pause on Fetch requests with Service Worker Debugging
Last updated: May 1, 2019
There are powerful debugging capabilities for Service Workers in DevTools.
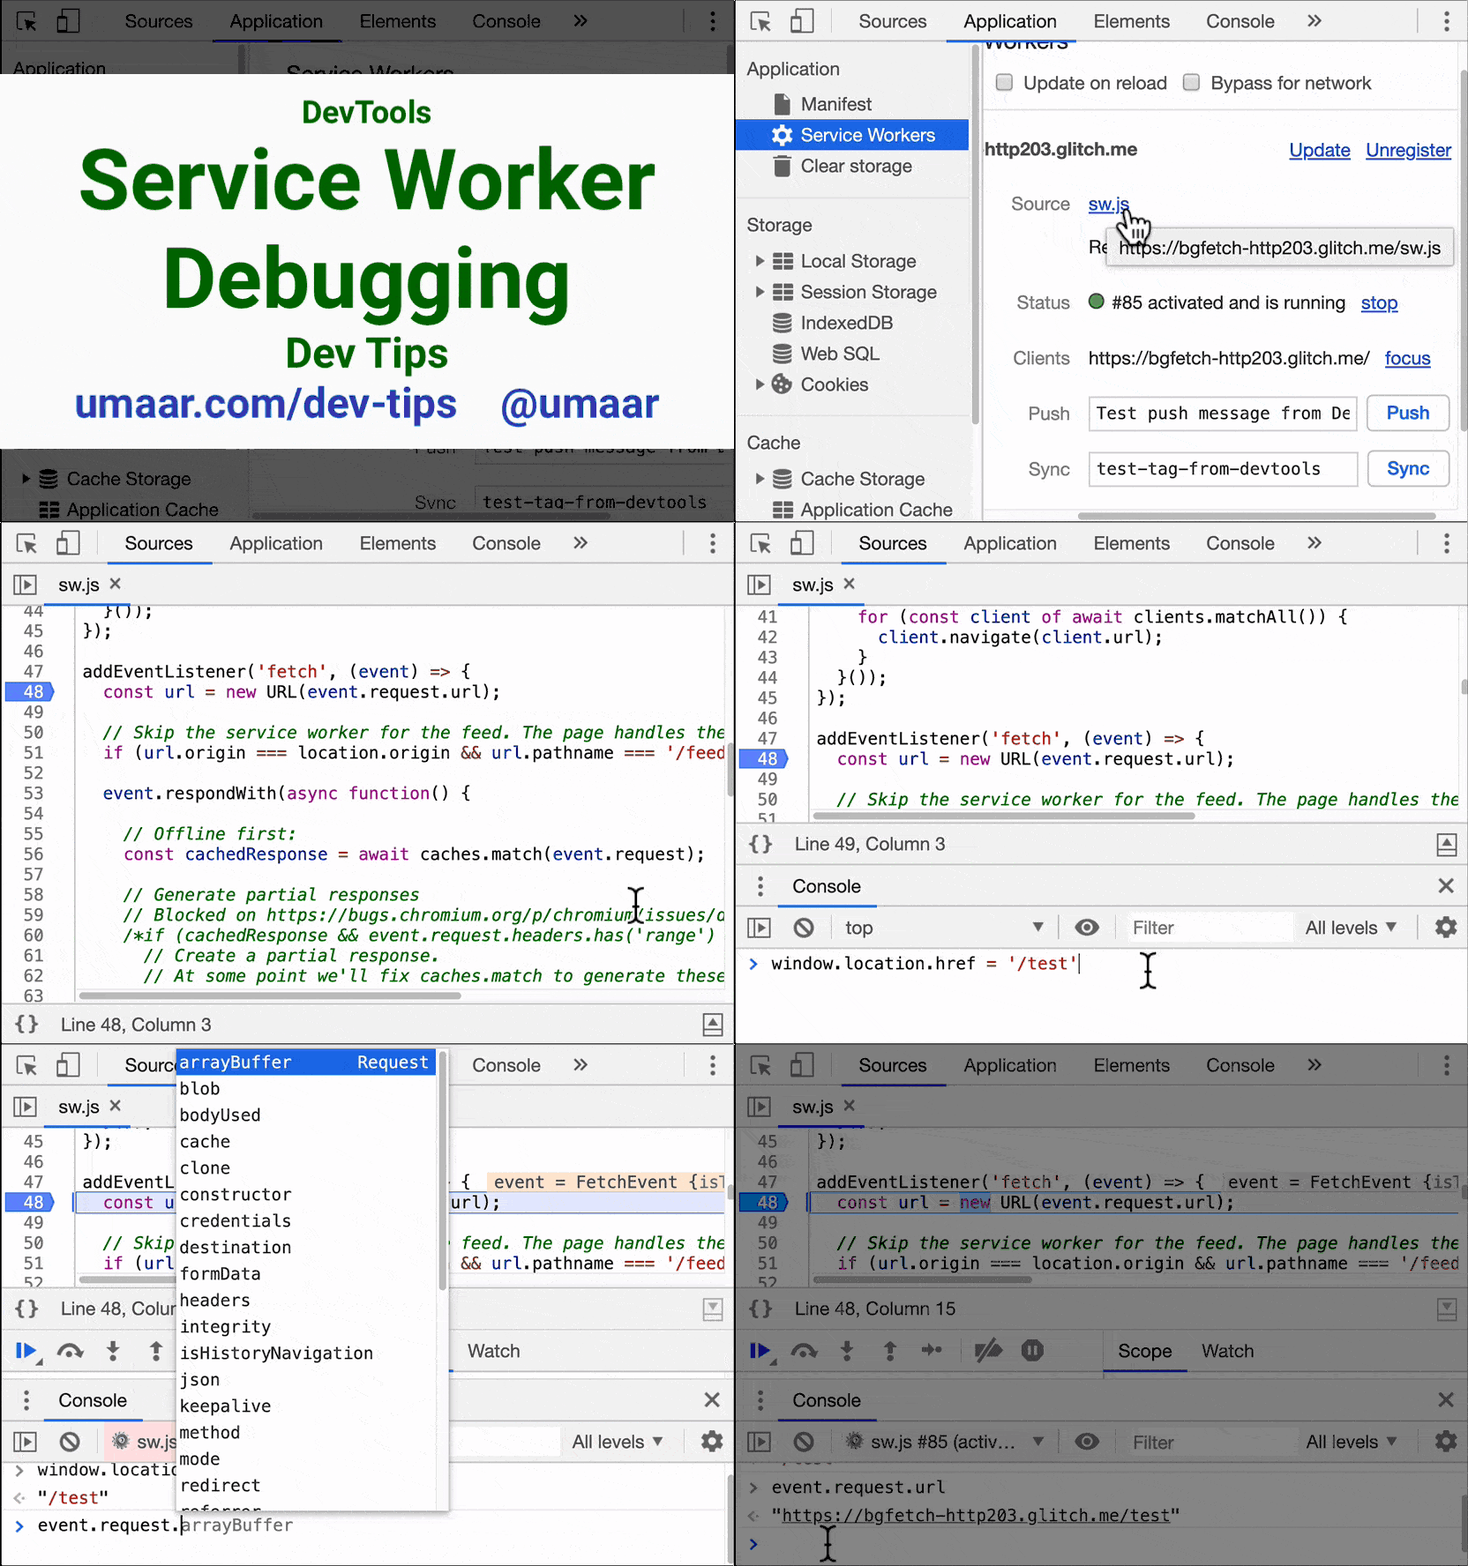
Click on a Service Worker from the Application Panel - if the website you are inspecting uses one (the Service Worker-enabled site used in the video).
Once you have selected a Service Worker, the Sources Panel editor opens up, along with the usual debugging features you are used to, like setting breakpoints. You may find a fetch handler which starts like this:
addEventListener('fetch', event => {
  const url = new URL(event.request.url);
  // ^ A breakpoint could be set on the line above
});
If you set a breakpoint within the body of the callback function, you can 'trigger' the Service Worker fetch event - by changing the URL for example. You then pause at the breakpoint within the Service Worker code.
💡️ Tip: Investigate other actions which may trigger the Service Worker fetch breakpoint. As an example, how about dynamic imports? Try executing the following in the Console Panel to trigger the fetch handler:
import('/hello.js');