Chrome DevTools: Understand how DevTools works at a deeper level with the protocol monitor
Last updated: March 13, 2018
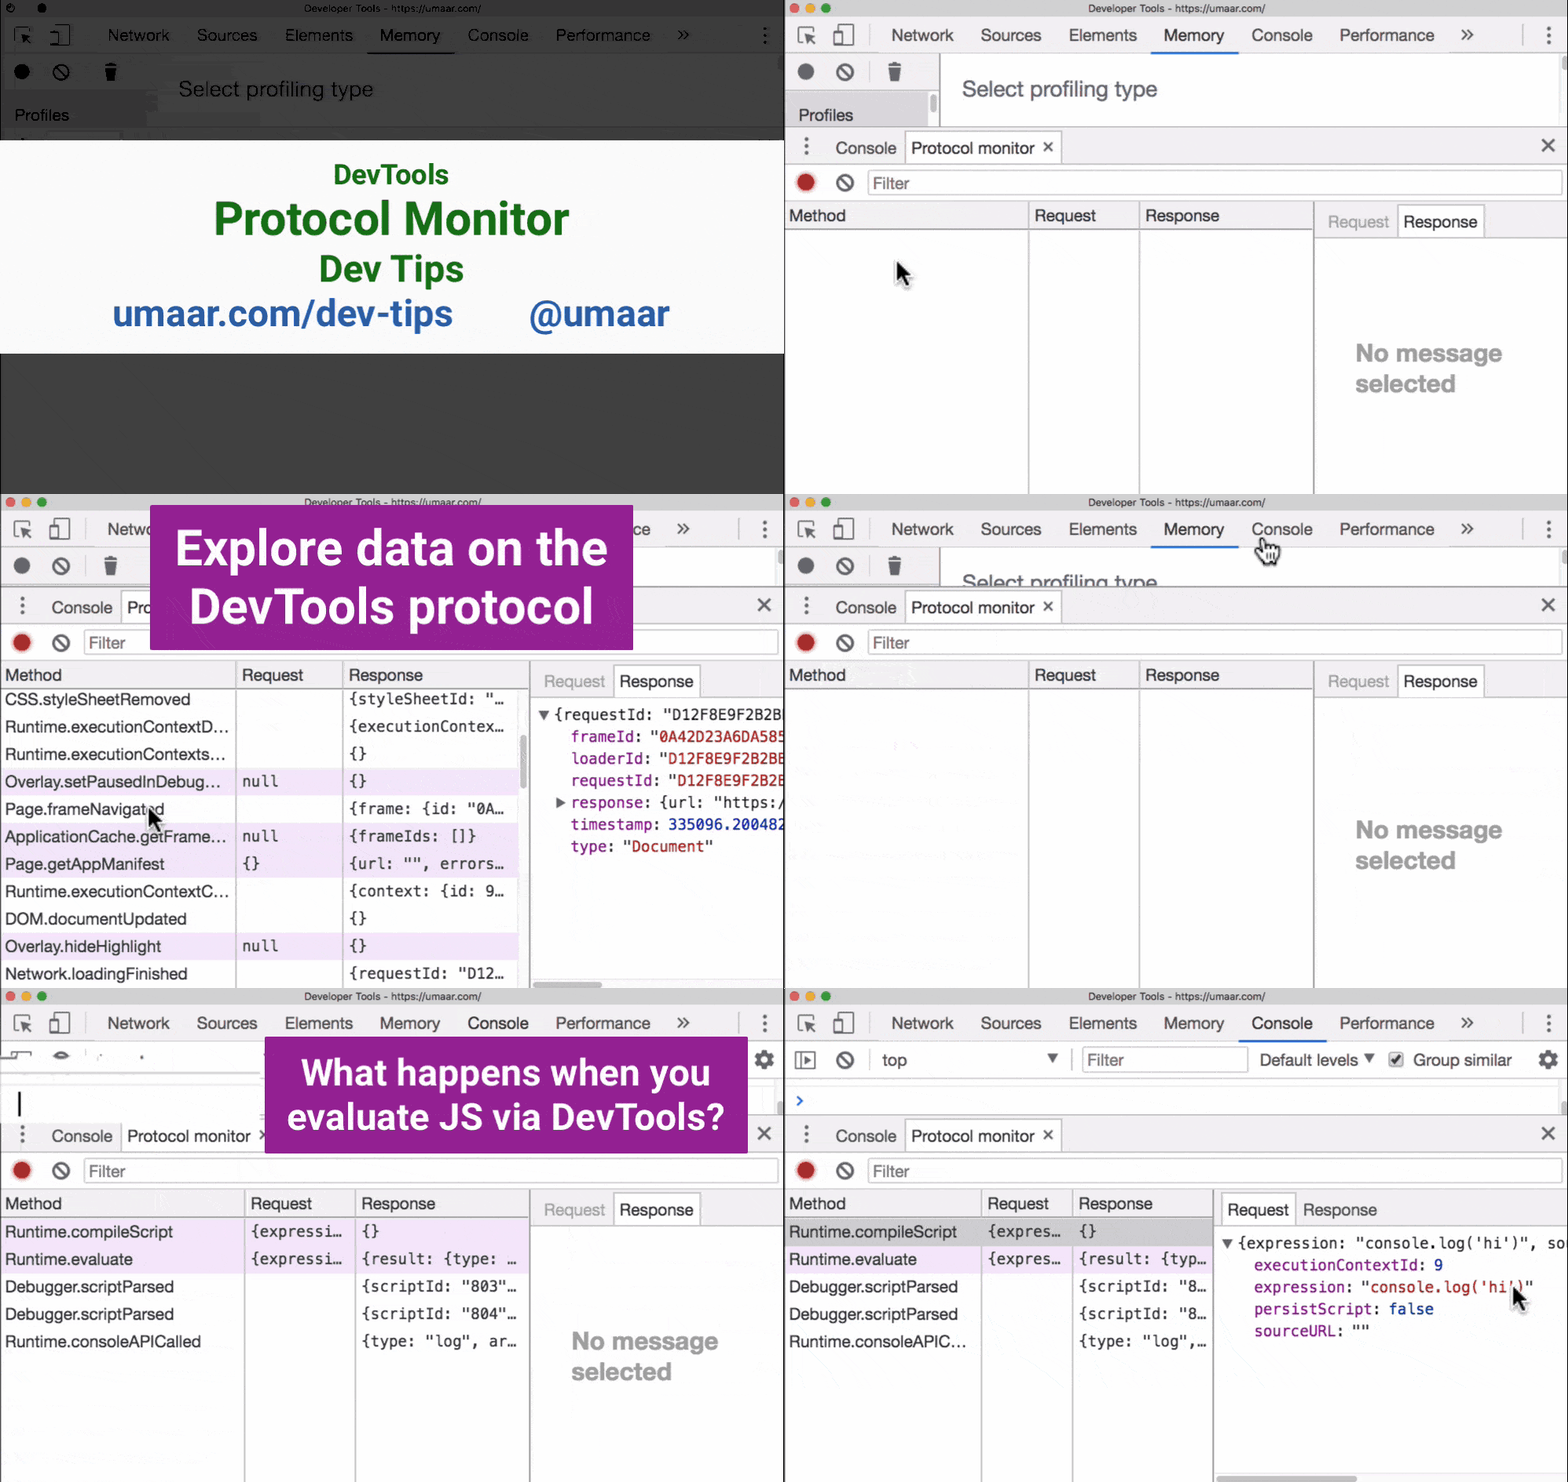
The experimental Protocol Monitor displays the underlying requests and responses happening over the DevTools protocol.
For example, when evaluating some JavaScript via DevTools, observe the following messages on the protocol:
Runtime.compileScriptRuntime.evaluateDebugger.scriptParsedDebugger.scriptParsedRuntime.consoleAPICalled
Many UI actions, such as inspecting elements, will trigger messages to be sent/received over the protocol. As an exercise, try these actions out yourself and observe the payloads.