Chrome DevTools: Your backend server timing performance, visualised in DevTools
Last updated: March 17, 2017
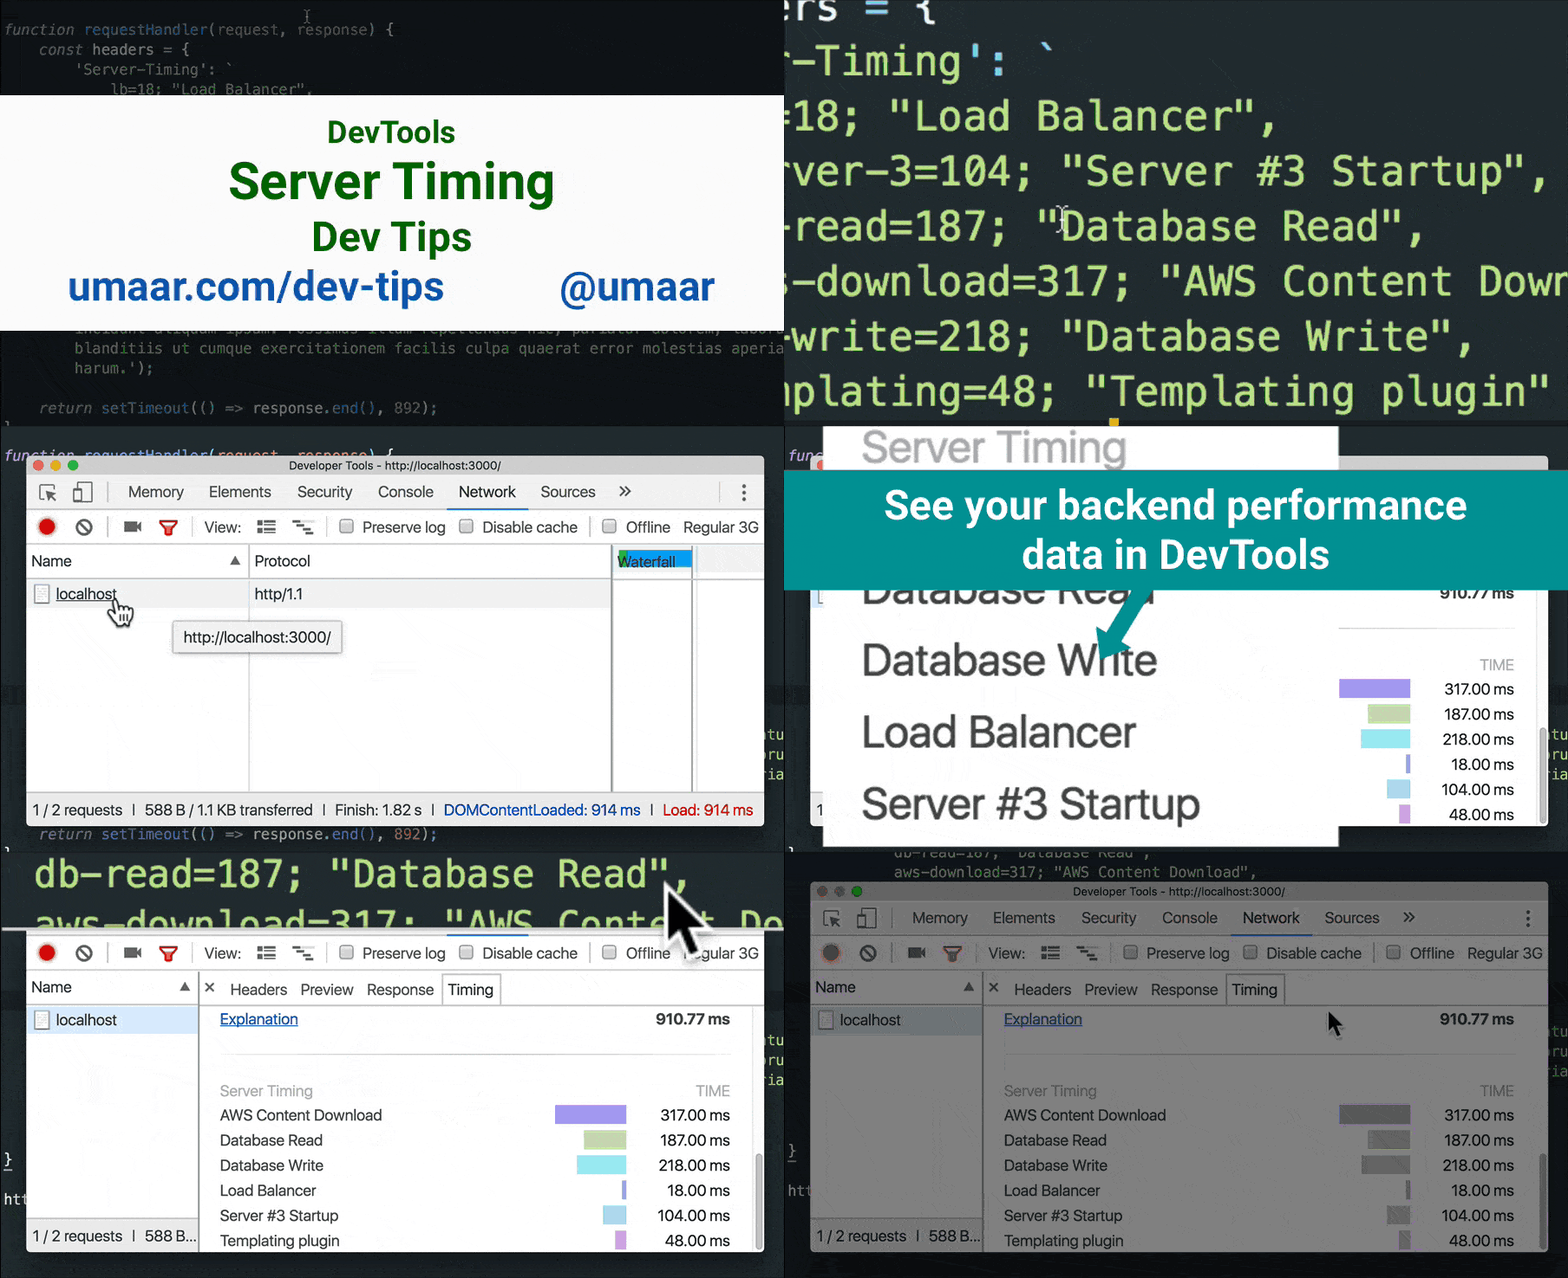
The Chrome DevTools will display your backend server timing metrics when you provide the Server-Timing HTTP header field.
Here's a code example in Node.js:
const headers = {
	'Server-Timing': `
		lb=18; "Load Balancer",
		server-3=104; "Server #3 Startup",
		db-read=187; "Database Read",
		aws-download=317; "AWS Content Download",
		db-write=218; "Database Write",
		templating=48; "Templating plugin"
	`.replace(/\n/g, '')
};

response.writeHead(200, headers);
In the above example, headers['Server-Timing'] contains relevant server timing data which DevTools displays in the Timing pane in the Network Panel.
Note: Having backend performance metrics in your production website may be useful. If you consider implementing this, you should be aware of Timing attacks as potential attack vectors.
Update: Network on Timeline is in Chrome Stable!