Chrome DevTools: Use Inline Breakpoints for greater debugging granularity
Last updated: January 13, 2017
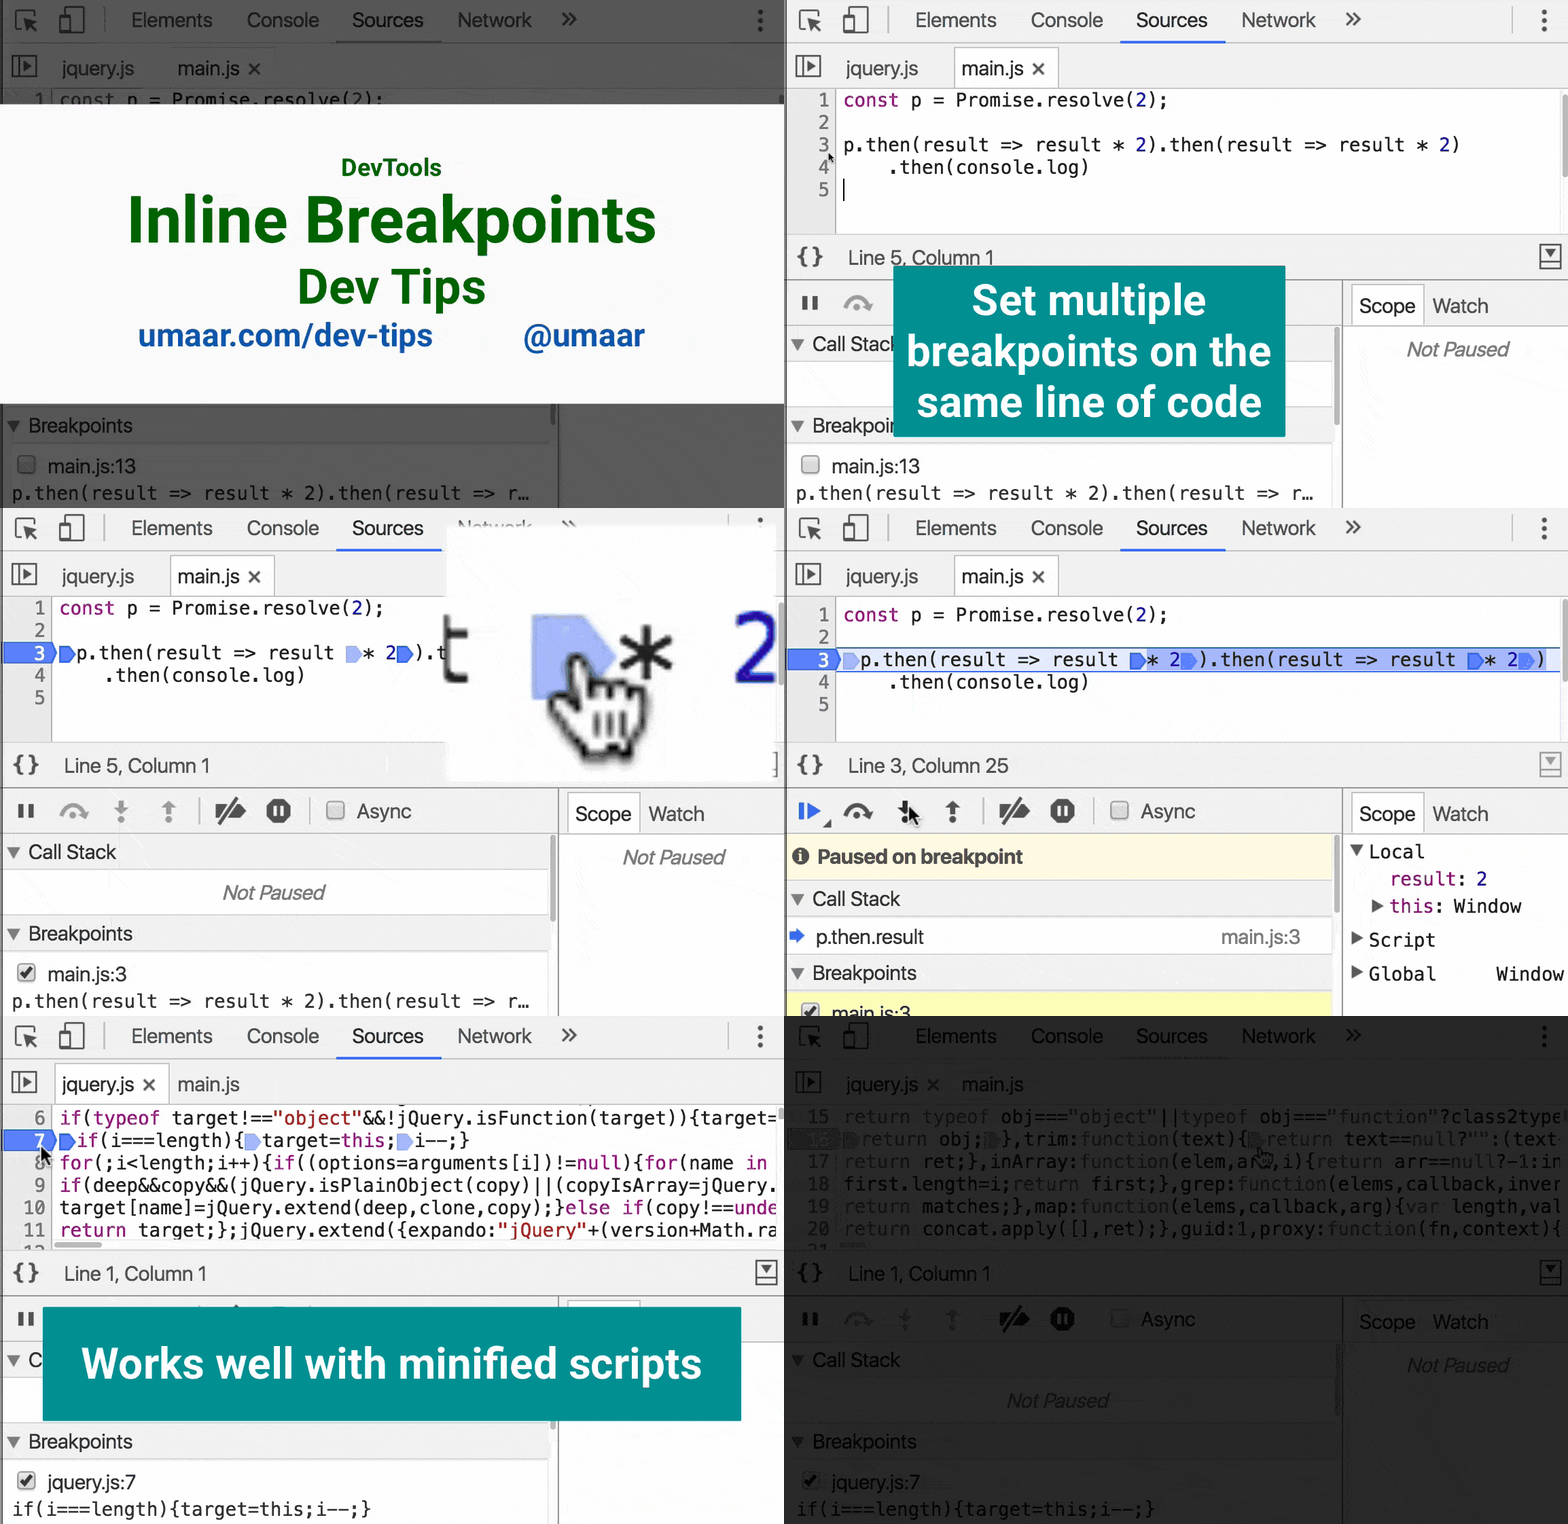
The Inline Breakpoints feature allows you to set multiple breakpoints on a single line of code. This works nicely with minified scripts.
To try this out, set an initial breakpoint by clicking on the line number. Light blue markers now appear on this same line next to any place where an inline breakpoint can be set.
Note: the Inline Breakpoints feature is fully compatible with Conditional Breakpoints, this means you can instruct the debugger to pause on a breakpoint only if a certain condition is met.
Update: The updated Sensors Pane is in Chrome Stable!