Chrome DevTools: Get performance insights into your JS code with console.timeStamp
Last updated: November 27, 2015
Note: We already covered console.time(). Now we're going to look at console.timeStamp()
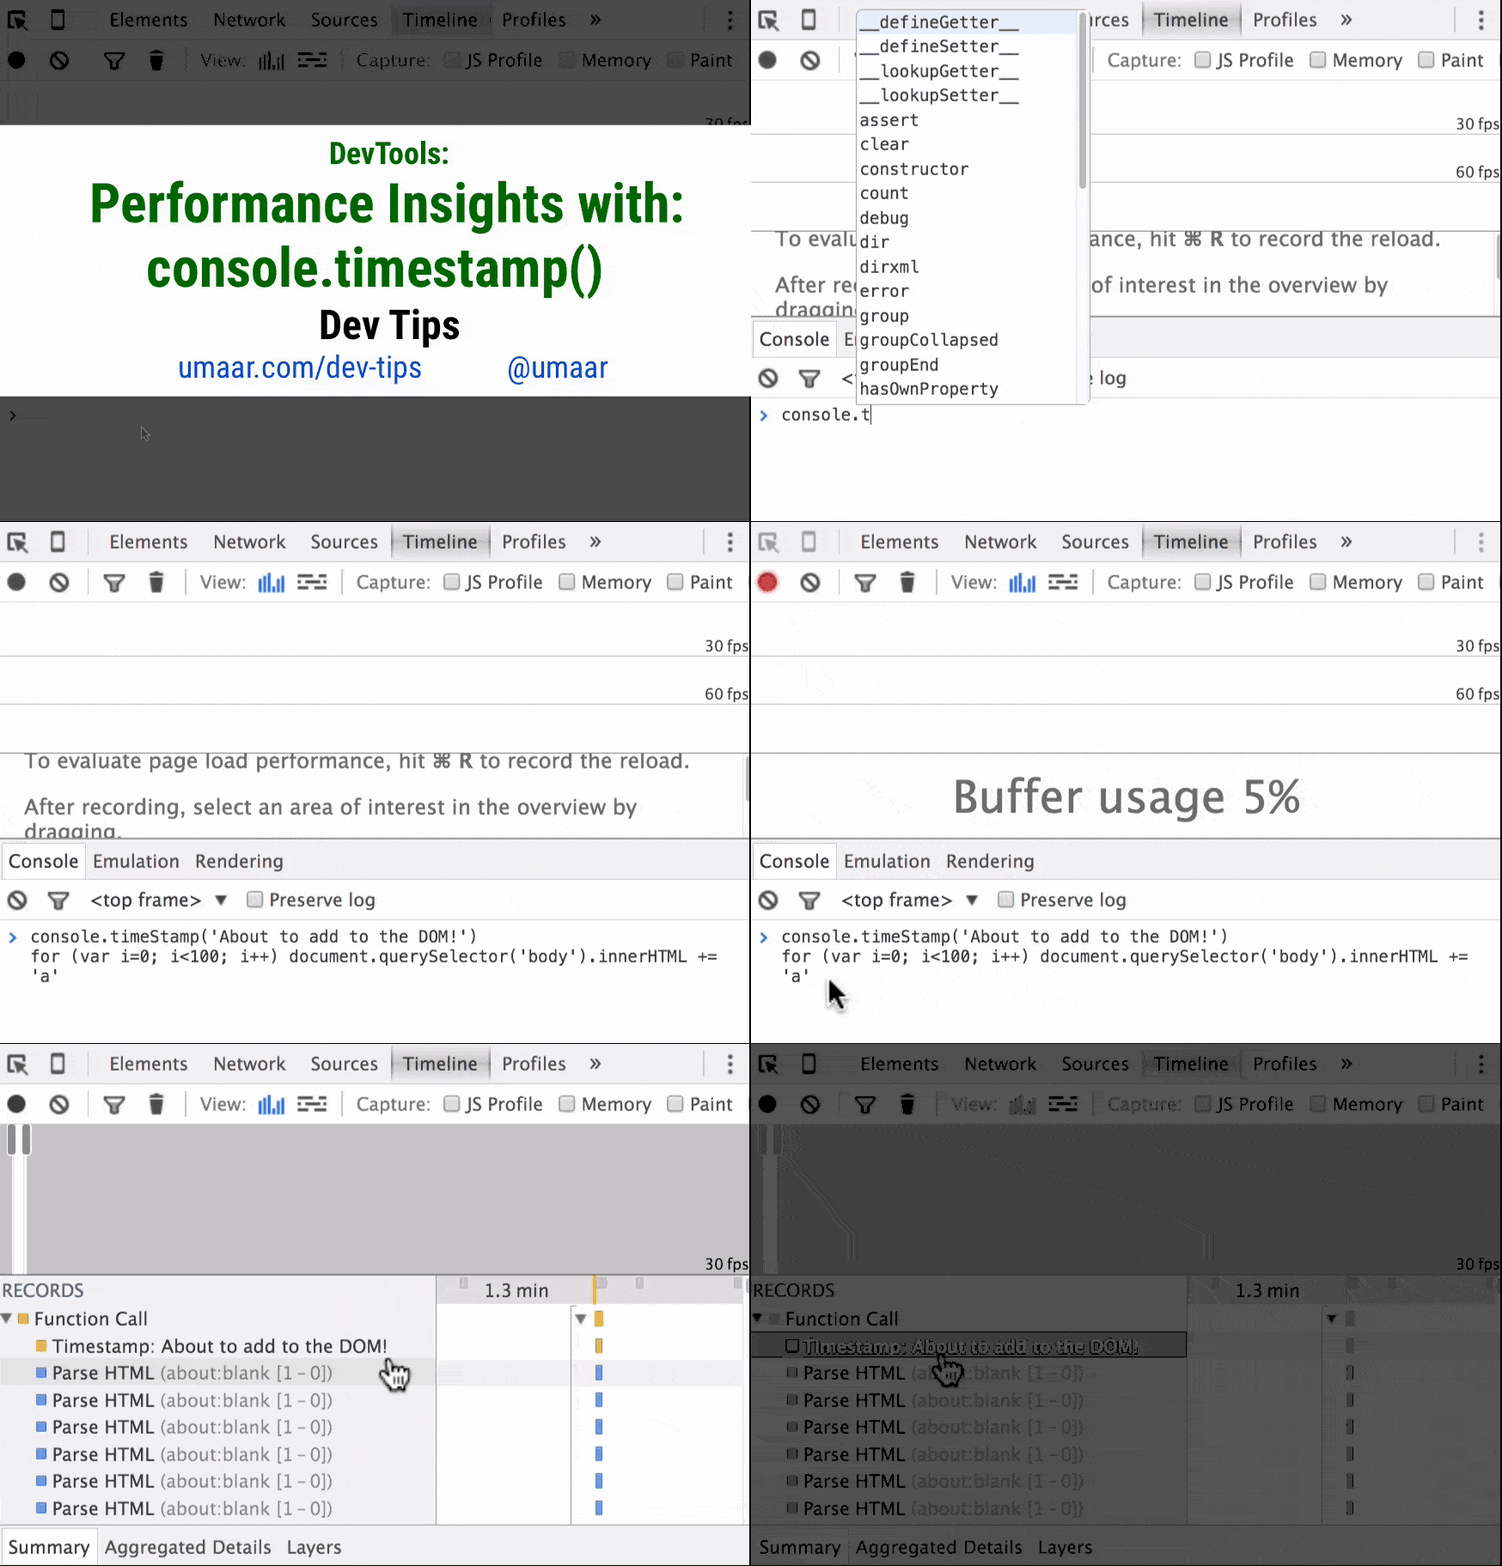
Increase your understanding of the Timeline Panel by annotating a recording with your own markers. You can add your own marker to a Timeline recording. To do this: run this code in the Console Panel while a recording is active in the Timeline panel.
console.timeStamp('My operation #1');If you inspect the Timeline recording details, you can see a 'record' (or 'marker') for the console.timeStamp call. If you include these calls before and after you perform expensive operations in your codebase, you can easily identify the significant records in a Timeline recording.