DevTools: A better to way to visualize your JavaScript
Last updated: April 18, 2023Introduction
The Lighthouse Treemap provides a graphical representation 📊 of your JavaScript bundles. Compatible with sourcemaps, it helps you understand the JavaScript modules used by your webpage. It can even show you unused bytes!
To try this out on a website:
- From the Lighthouse Panel in DevTools, run a Performance profile.
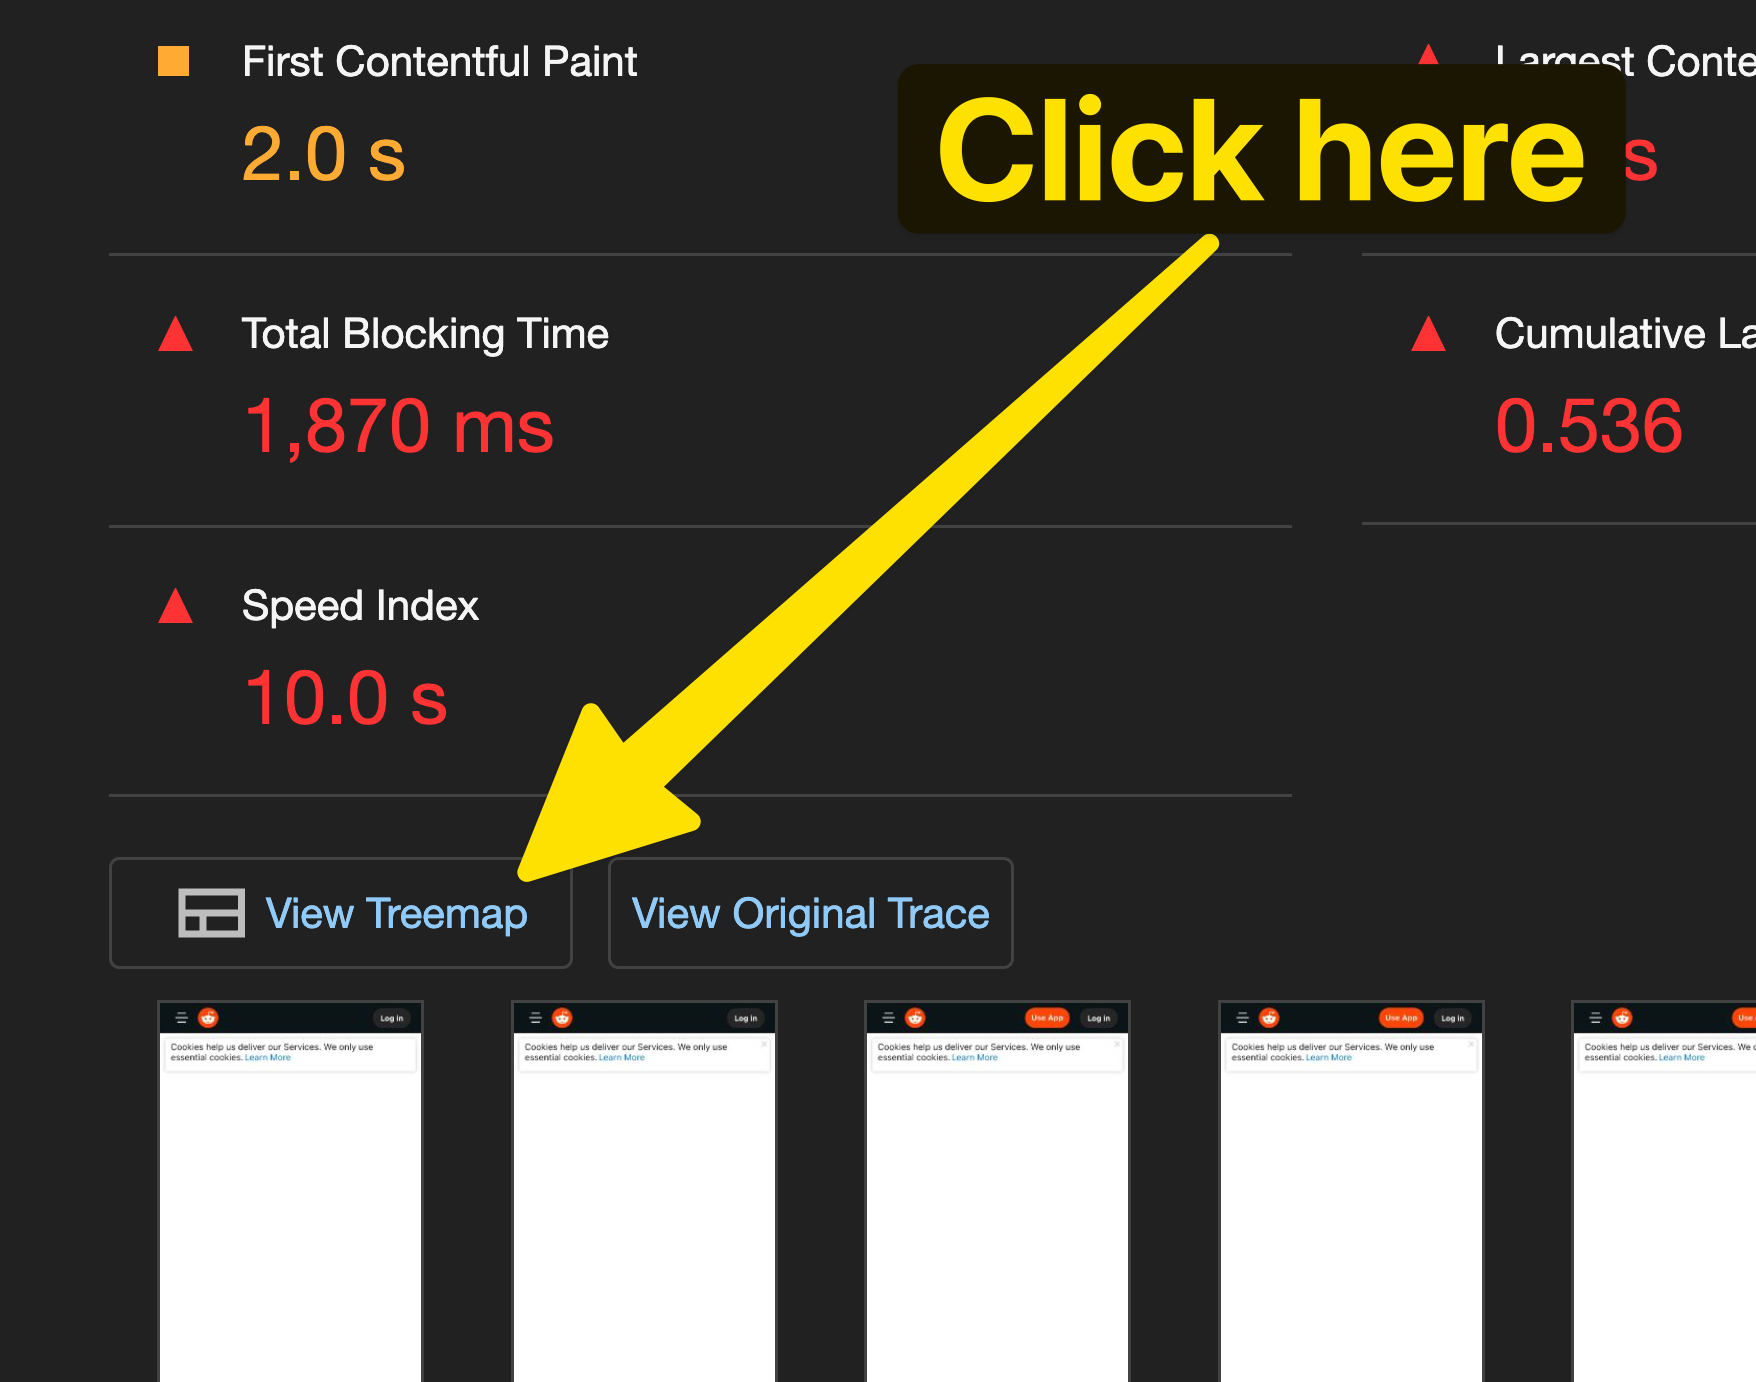
- In the resulting Lighthouse profile, click View Treemap.

- Explore the various parts which make up your bundle. You can also highlight unused bytes, and dive into code that uses sourcemaps.
What next
Good job on viewing the Lighthouse Treemap. From here, you can:
- Select specific bundles you want to dive into.
- Navigate between different files, within those different bundles.
- Highlight the unused bytes within bundles.
- View detailed coverage statistics in the coverage area located near the bottom of the page.
Source maps
With the help of sourcemaps, the visualization can display your original source files, such as TypeScript files. Exploring files within the node_modules is something I use a lot - to keep my bundles at a reasonable size. The visualization highlights third-party scripts that consume a significant amount of bytes.
Bonus tip
You can also run Lighthouse from the command line, and generate a Treemap report! This can be useful in a continuous integration environment.
Browser support
This feature works in the stable versions of Chrome and Edge.