Chrome DevTools: Refactor and improve your stylesheets with the CSS Overview Panel
Last updated: November 18, 2020
Introduction
The CSS Overview Panel provides interesting information on your CSS. You can view high-level CSS metrics which are especially useful when refactoring.
How to use this feature
Enable this feature:
- Enable CSS Overview from the DevTools Experiments pane (Cmd + Shift + P > Show Experiments)
- Select Show CSS Overview from the DevTools Command Menu (Cmd + Shift + P)
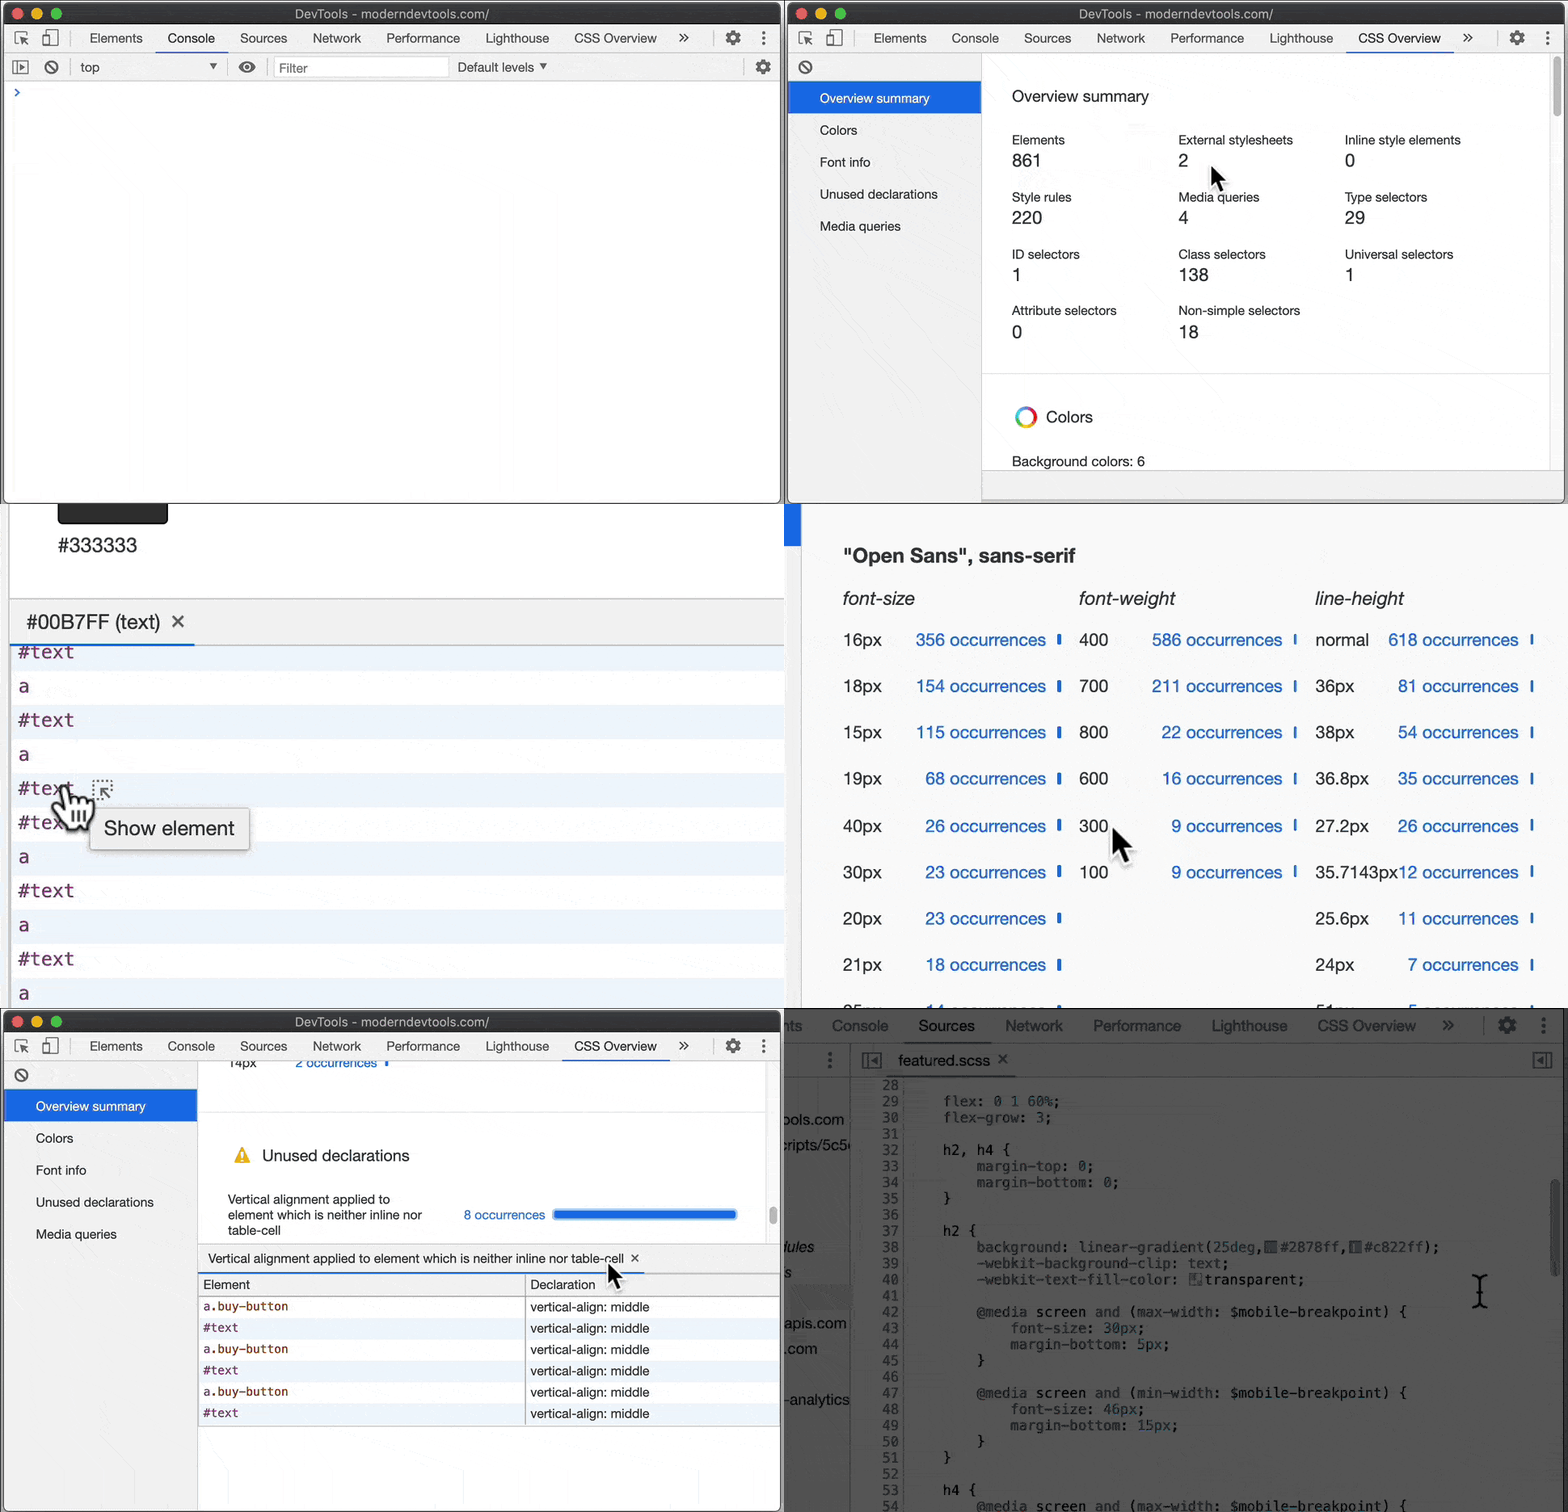
In the CSS Overview Panel, you can navigate to different sections:
- Overview Summary - Interesting metrics on your CSS, such as number of elements, stylesheets, class vs ID selectors, complex selectors and more.
- Colors - A visual preview of background colors, text colors, fill colors and border colors. The colors themselves are clickable, so you can view exactly which element(s) use such color.
- Font info - Metrics on font usage and how often they appear within stylesheets. Includes font weight and line height metrics. Font metrics can be selected to reveal affected elements.
- Unused declarations - Unused CSS declarations, which can be clicked on as usual.
- Media queries - Details of CSS media queries (such as min/max-width values) and how often they occur in stylesheets. You can click on these to jump straight to the Sources Panel. If you have source maps enabled, you'll be able to see the original styles, such as Sass.
When to use this feature
Use this when refactoring your code, or normalising brand styles across pages. For example, if you notice slight variations of a "primary" color scattered around your CSS, this Colors pane in the Overview panel is a great place to identify such a thing.
You can also use the Media queries pane within the CSS Overview Panel to check you are targeting the expected set of media query breakpoints and ensuring your pages look good on a variety of screen dimensions.
The Unused declarations pane may help improve the network and render performance by informing you which CSS can be removed.
Finally, you can use the CSS Overview panel to communicate information to the rest of your front-end team, especially new starters, on the state of the CSS code, including areas which may need focussing upon.
Extra
- While the CSS Overview Panel can provide valuable metrics on CSS, the Lighthouse Panel provides metrics on your whole site, including JavaScript. I wrote about it in this article What’s New in DevTools 2020.
- In addition to the article above, I've also written a guide to using Lighthouse to debug accessibility. Check it out: Accessibility In DevTools.