Chrome DevTools: See the Initiator Chain for a given request
Last updated: December 13, 2019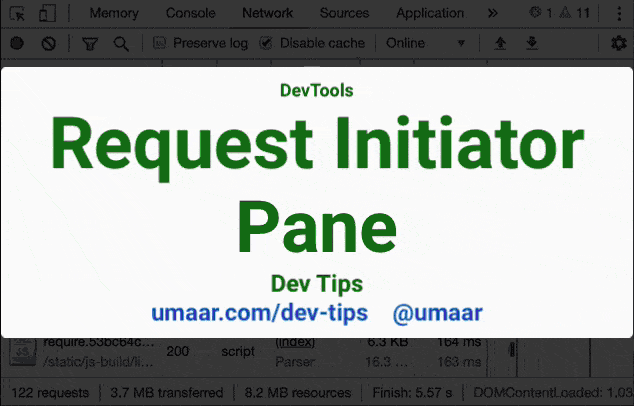
The new Request Initiator Pane in DevTools shows the Initiators and Dependencies for the selected Network Panel Request.
To access it:
- Click on a request in the Network Panel
- Select the Initiator Pane
In the Chain view ⛓️ your selected request is bold, and requests below it are dependencies. Everything above led to the initiation of the selected request.
Where applicable, a JavaScript callstack is shown for the selected request. This callstack can show you the exact line of code which initiated the request e.g. (new Image()).src = 'image.jpg'.
While this provides less information, a quicker way of doing this is to hold shift while you hover over resources in the Network Panel.