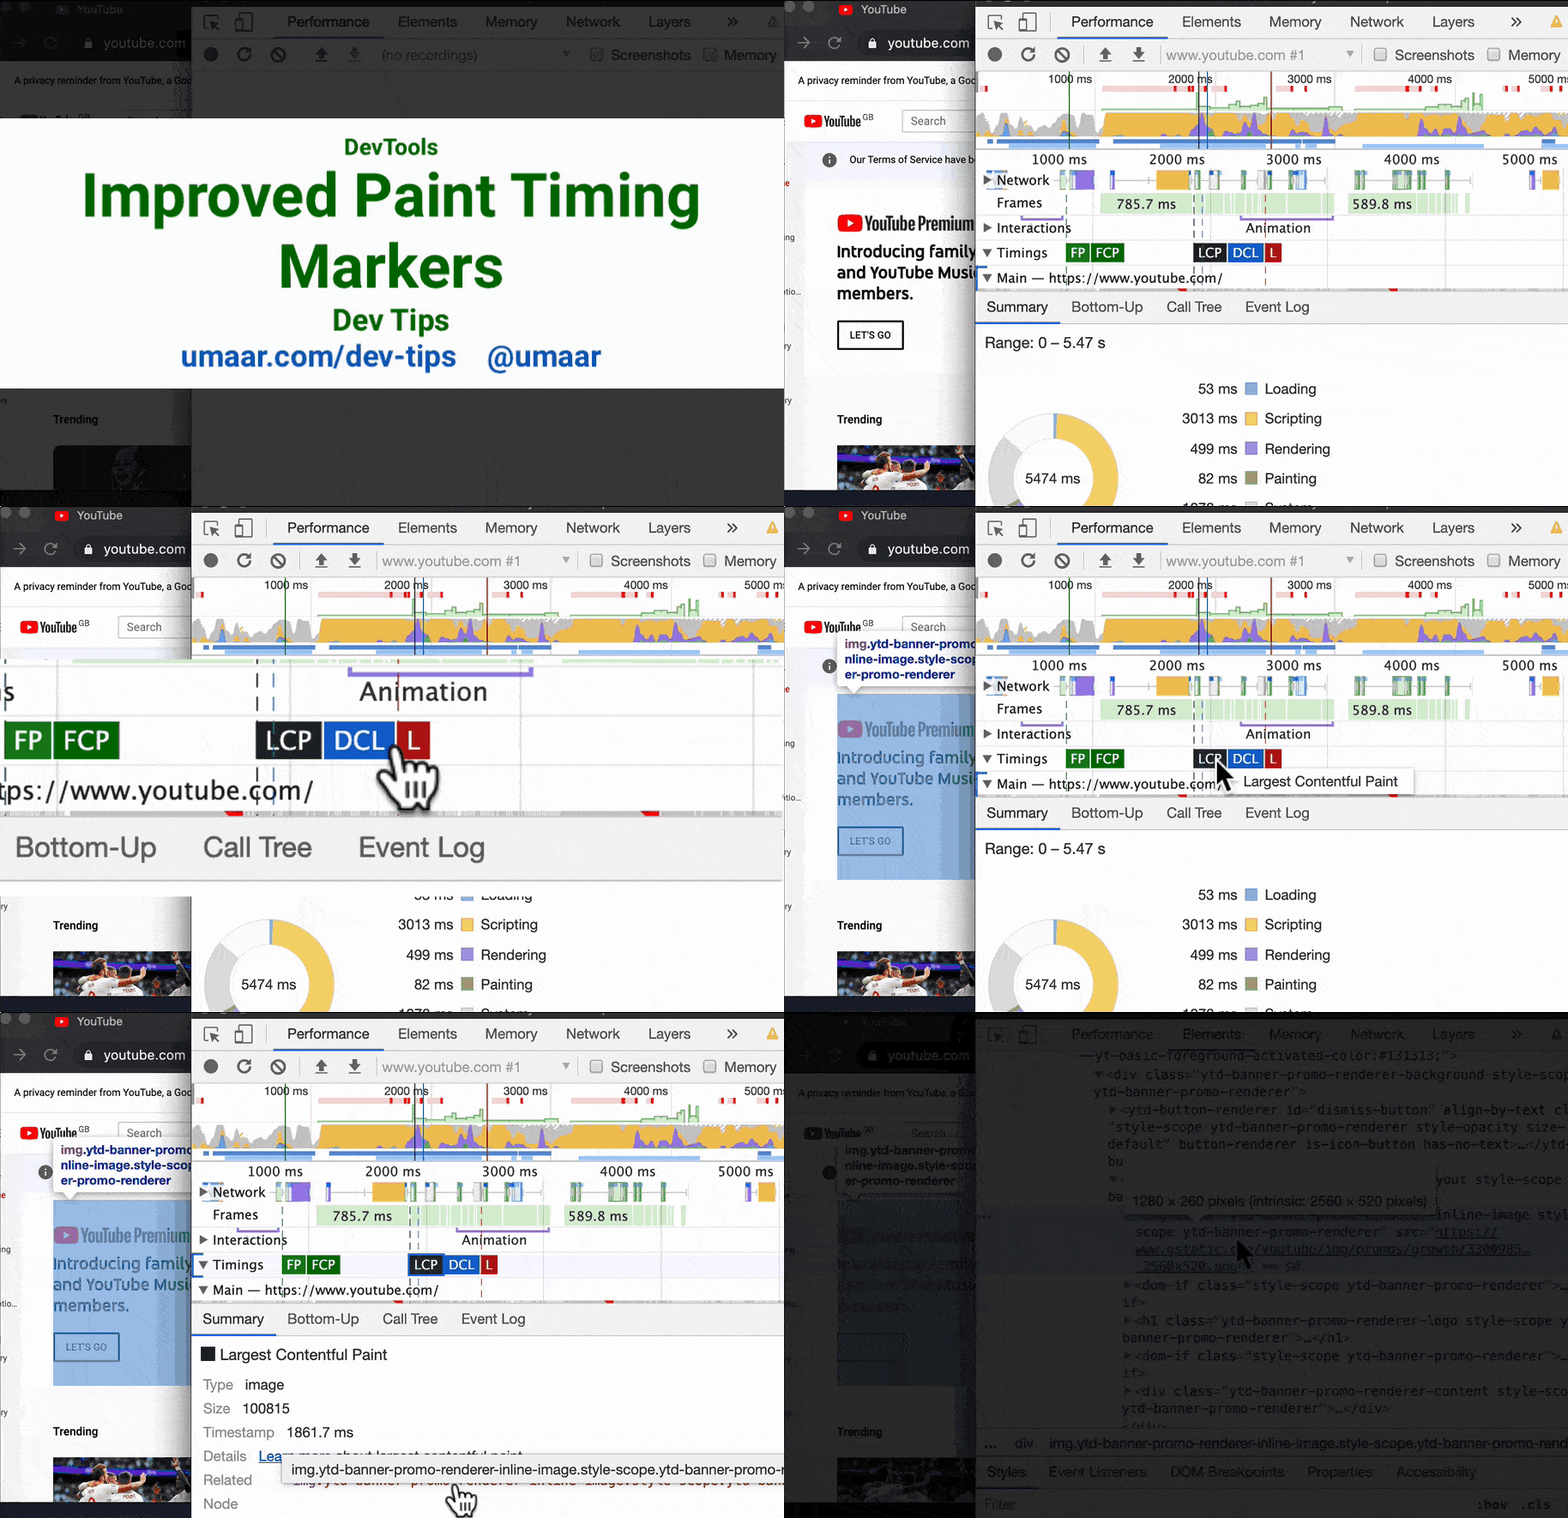
Chrome DevTools: Identify which element contributed to the Largest Contentful Paint
Last updated: September 10, 2019
The Paint Timing Markers in DevTools highlights key rendering milestones in your page load. Milestones include:
- First Paint
- First Contentful Paint
- Largest Contentful Paint
- DOMContentLoaded Event
- Onload Event
The Largest Contentful Paint marker in DevTools can now pinpoint which element was considered for this event. To see the element (once you have a Performance Panel recording), you have a few options:
- Hover over the LCP marker in the Performance Panel - the relevant element is highlighted on the page
- Click the LCP marker and find the
Related Nodeitem in the Summary Pane. Clicking on this node takes you straight to the element DOM node in the Elements Panel
The Performance Panel has a heap of information, to make things easier, you can often correlate easy-to-identify markers, like the LCP, to Network events and rendering screenshots, all within the same Performance Panel recording.