Chrome DevTools: Inspect Audio with the Web Audio Inspector
Last updated: August 27, 2019
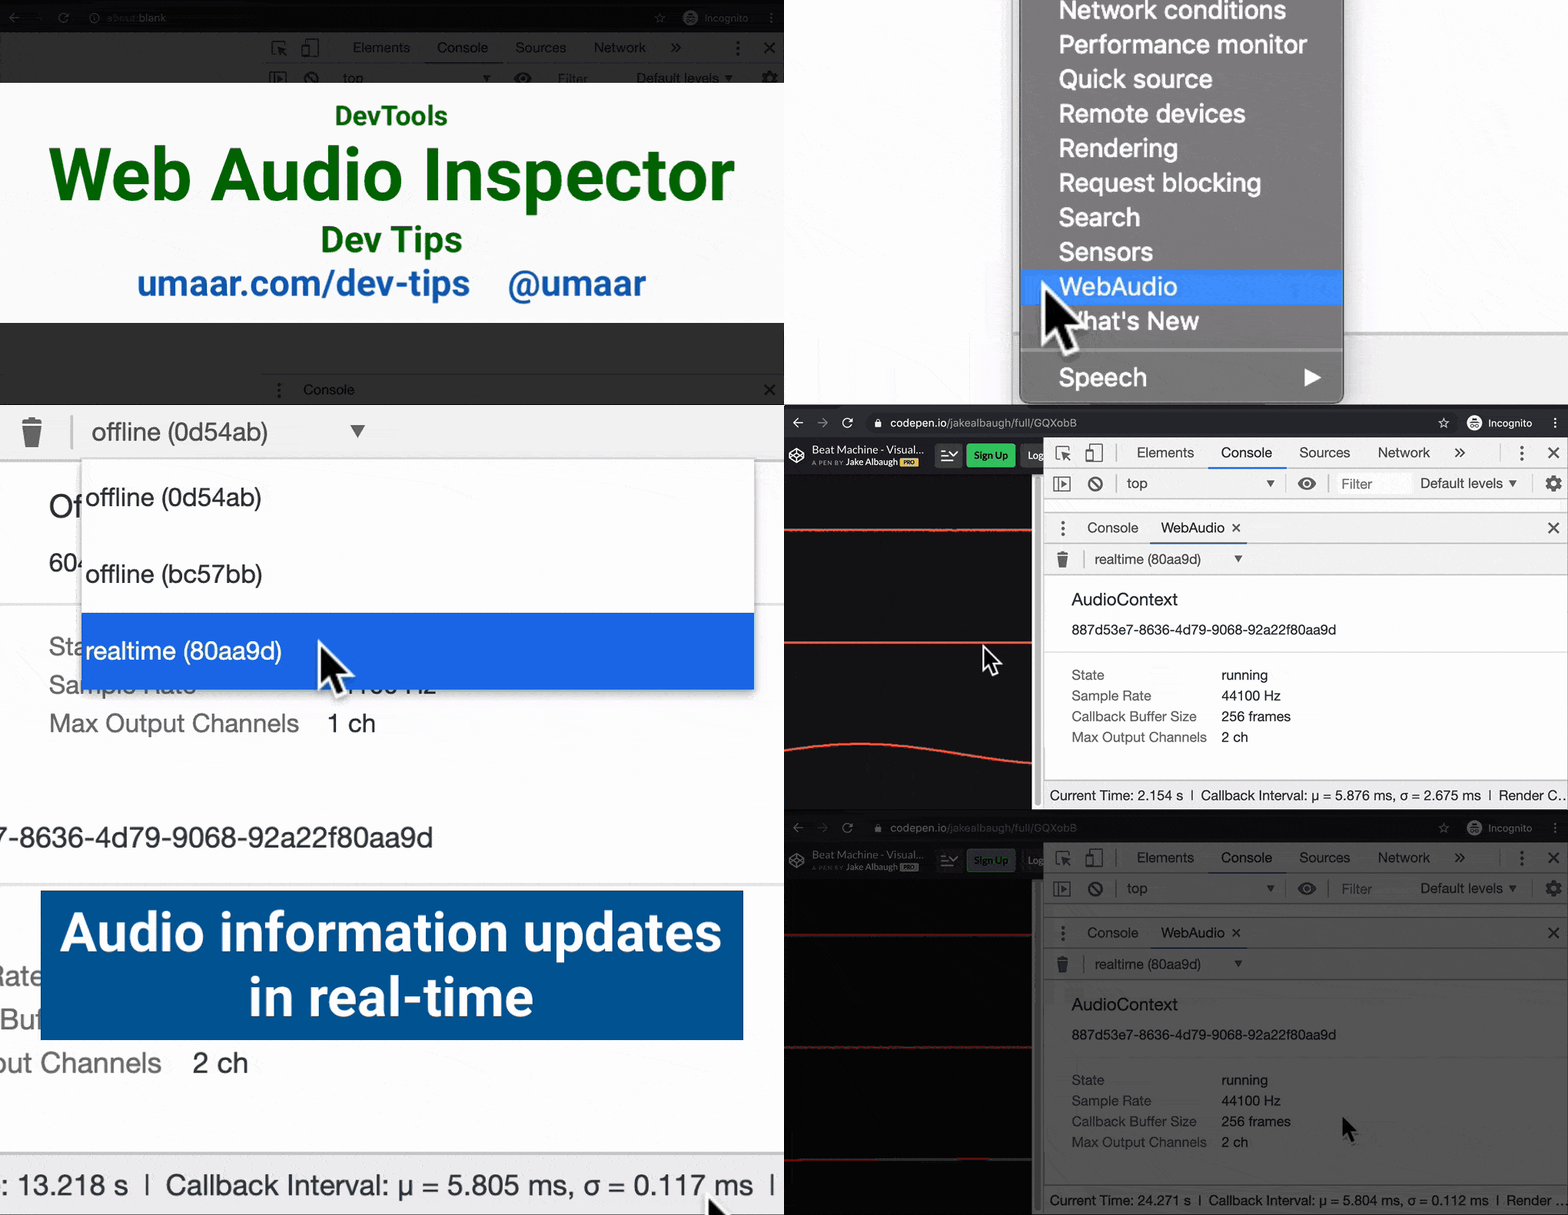
You can use the Web Audio Inspector to inspect the details of AudioContexts - part of the Web Audio API. The Audio Inspector within Chrome DevTools displays information such as:
- State (running)
- Sample rate (44100Hz)
- Callback Buffer Size (256 frames)
- Max Output Channels (2 ch)
- Current play time (10.2s)
- Callback Interval (5ms)
- Render Capacity (1.2%)
You can try the Web Audio Inspector on a page which uses the Web Audio API, such as webaudioapi.com. Select WebAudio from the DevTools drawer (Three dots > More Tools > WebAudio).