Chrome DevTools: Quick debugging of your Node.js code straight from DevTools
Last updated: June 5, 2017
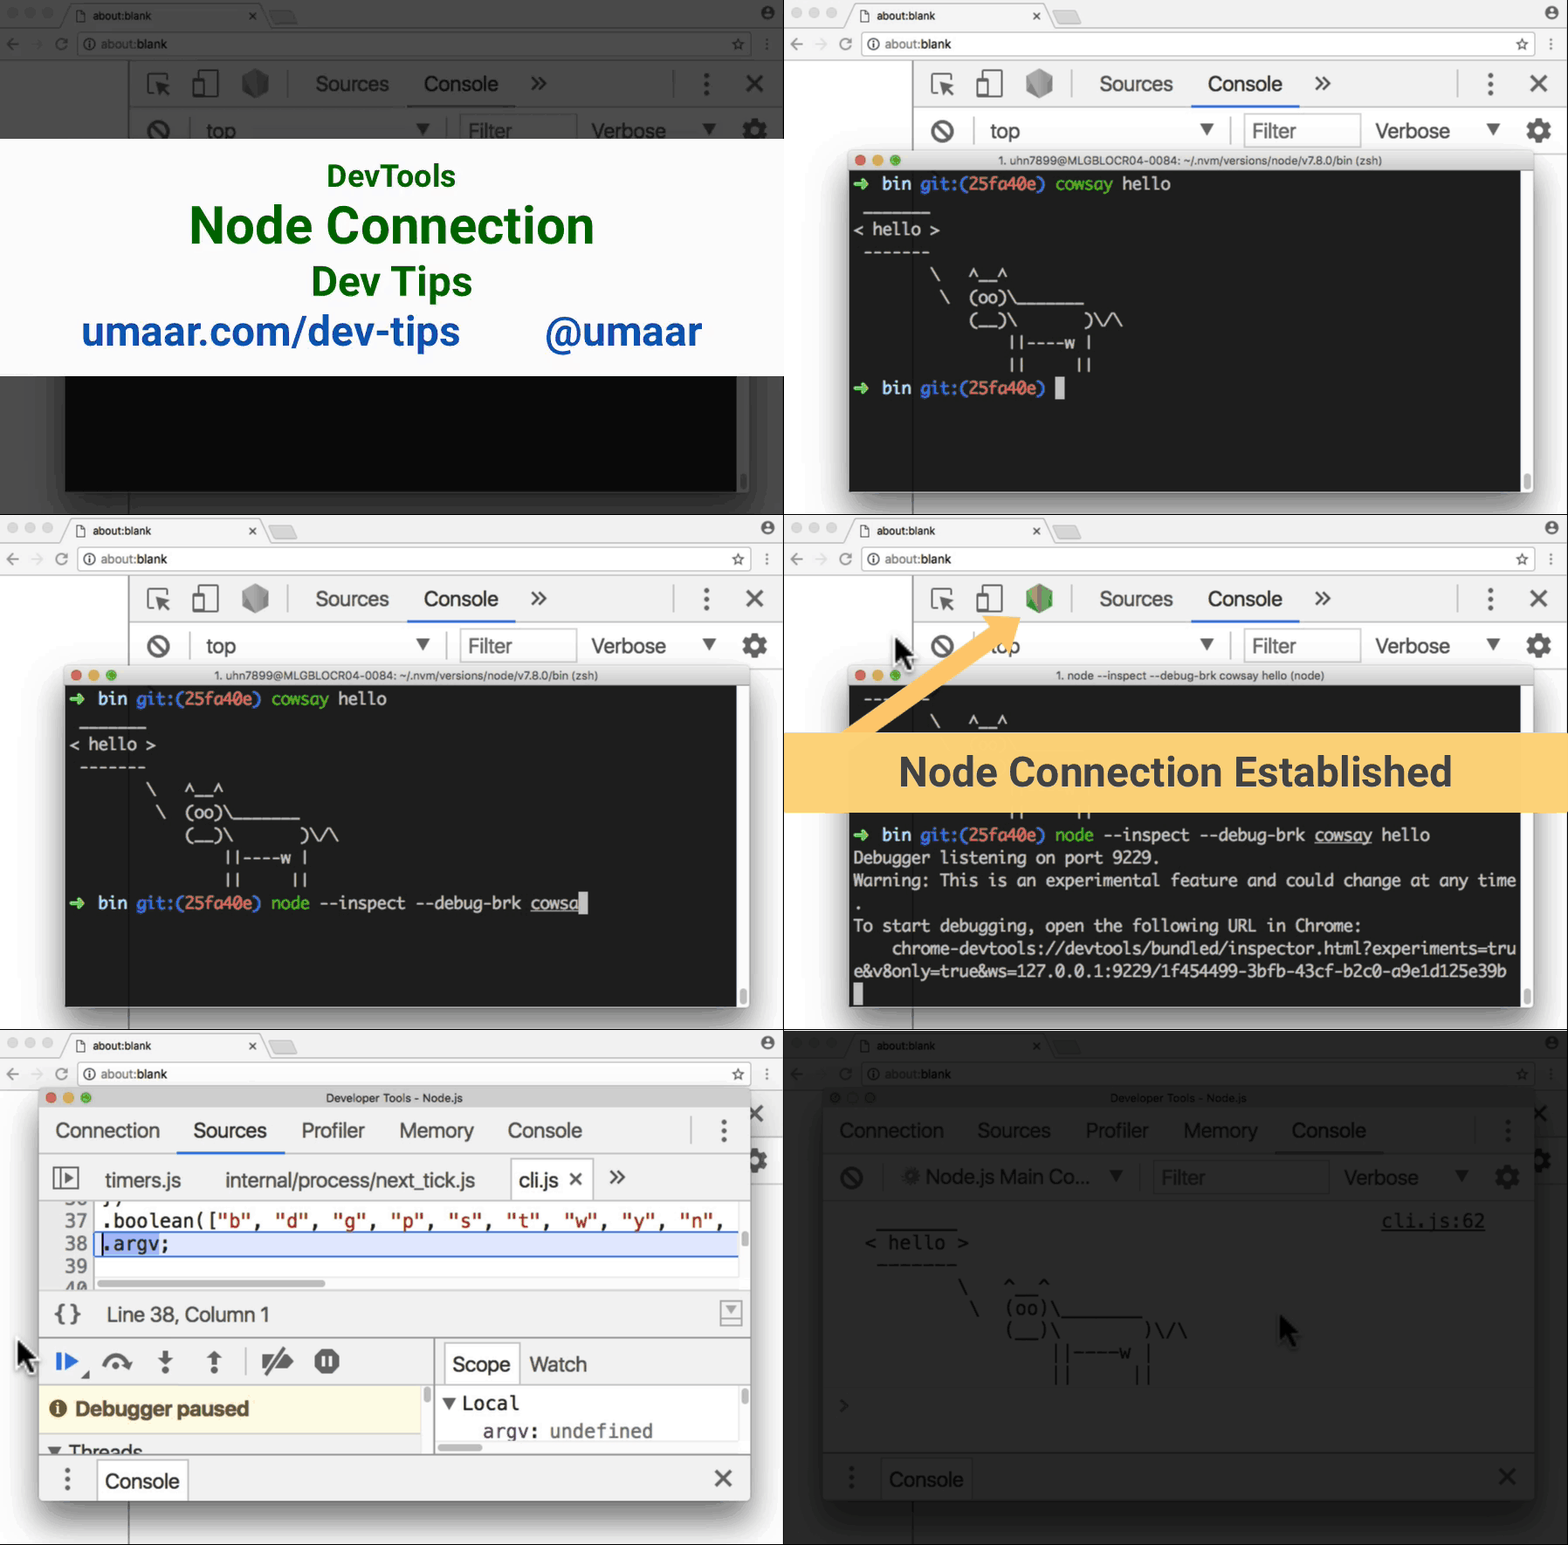
You can pass command line arguments to Node.js to specify a remote debugging session.
node --inspect --debug-brk node-script.jsNode will output something like this
Debugger listening on port 9229.
Warning: This is an experimental feature and could change at any time.
To start debugging, open the following URL in Chrome:
    chrome-devtools://devtools/bundled/inspector.html?experiments=true&v8only=true&ws=127.0.0.1:9229/
Instead of copying and pasting that URL each time, your usual DevTools will display a small Node.js logo in the DevTools toolbar. Click on the icon and a dedicated instance of DevTools opens up for your running Node.js process.